Stackdriver (Stats)

Introduction
This guide makes use of Stackdriver for visualizing your data. For assistance setting up Stackdriver, Click here for a guided codelab.
Stackdriver Monitoring provides visibility into the performance, uptime, and overall health of cloud-powered applications. Stackdriver collects metrics, events, and metadata from Google Cloud Platform, Amazon Web Services, hosted uptime probes, application instrumentation, and a variety of common application components including Cassandra, Nginx, Apache Web Server, Elasticsearch, and many others.
Stackdriver ingests that data and generates insights via dashboards, charts, and alerts. Stackdriver alerting helps you collaborate by integrating with Slack, PagerDuty, HipChat, Campfire, and more.
OpenCensus Java has support for this exporter available through package:
- Exporters/Stats io.opencensus.exporter.stats.stackdriver
Creating the exporters
To create the exporters, you’ll need to:
- Have a GCP Project ID
- Have already enabled Stackdriver Monitoring, if not, please visit the Code lab
- Use Maven setup your pom.xml file
- Create the exporters in code
Stackdriver’s minimum stats reporting period must be >= 60 seconds. Find out why at this official Stackdriver advisory
Using OpenCensus for metrics involves three general steps:
- Importing the OpenCensus stats and OpenCensus Stackdriver exporter packages.
- Initializing the Stackdriver exporter.
- Using the OpenCensus API to instrument your code.
A basic example
Following is a minimal program that illustrates these steps. It runs a loop and collects latency measures, and when the loop finishes, it exports the stats to Stackdriver Monitoring and exits:
package io.opencensus.tutorial.stackdriver;

import io.opencensus.exporter.stats.stackdriver.StackdriverStatsExporter;
import io.opencensus.stats.Aggregation;
import io.opencensus.stats.Aggregation.Distribution;
import io.opencensus.stats.BucketBoundaries;
import io.opencensus.stats.Measure.MeasureDouble;
import io.opencensus.stats.Stats;
import io.opencensus.stats.StatsRecorder;
import io.opencensus.stats.View;
import io.opencensus.stats.View.Name;
import io.opencensus.stats.ViewManager;
import io.opencensus.tags.TagKey;
import java.io.IOException;
import java.util.Arrays;
import java.util.Collections;

/** StackdriverExample is an example of exporting a custom metric from OpenCensus to Stackdriver. */
public final class StackdriverExample {

  // The task latency in milliseconds.
  private static final MeasureDouble LATENCY_MS =
      MeasureDouble.create("task_latency", "The task latency in milliseconds", "ms");

  private static final StatsRecorder statsRecorder = Stats.getStatsRecorder();

  /** Main launcher for the Stackdriver example. */
  public static void main(String... args) throws IOException, InterruptedException {

    // Defining the distribution aggregations
    Aggregation latencyDistribution =
        Distribution.create(
            BucketBoundaries.create(
                Arrays.asList(
                    // Latency in buckets: [>=0ms, >=100ms, >=200ms, >=400ms, >=1s, >=2s, >=4s]
                    0.0, 100.0, 200.0, 400.0, 1000.0, 2000.0, 4000.0)));
     View view =
        View.create(
            Name.create("task_latency_distribution"),
            "The distribution of the task latencies",
            LATENCY_MS,
            latencyDistribution,
            Collections.<TagKey>emptyList());

    // Create the view manager
    ViewManager vmgr = Stats.getViewManager();

    // Then finally register the views
    vmgr.registerView(view);

    // Enable OpenCensus exporters to export metrics to Stackdriver Monitoring.
    // Exporters use Application Default Credentials to authenticate.
    // See https://developers.google.com/identity/protocols/application-default-credentials
    // for more details.
    // The minimum reporting period for Stackdriver is 1 minute.
    StackdriverStatsExporter.createAndRegister();

    // Record 100 fake latency values between 0 and 5 seconds.
    for (int i = 0; i < 100; i++) {
      double ms = Math.random() * 5 * 1000;
      System.out.println(String.format("Latency %d: %f", i, ms));
      statsRecorder.newMeasureMap().put(LATENCY_MS, ms).record();
      Thread.sleep(1000);
    }

    // Wait for a duration longer than reporting duration (1min) to ensure all stats are exported.
    Thread.sleep(60 * 1000);

    System.out.println("Done recording metrics");
  }
}
Insert the following snippet in your `pom.xml`:
<properties>
<project.build.sourceEncoding>UTF-8</project.build.sourceEncoding>
<opencensus.version>0.16.0</opencensus.version> <!-- The OpenCensus version to use -->
</properties>
<dependencies>
<dependency>
<groupId>io.opencensus</groupId>
<artifactId>opencensus-api</artifactId>
<version>${opencensus.version}</version>
</dependency>
<dependency>
<groupId>io.opencensus</groupId>
<artifactId>opencensus-impl</artifactId>
<version>${opencensus.version}</version>
<scope>runtime</scope>
</dependency>
<dependency>
<groupId>io.opencensus</groupId>
<artifactId>opencensus-exporter-stats-stackdriver</artifactId>
<version>${opencensus.version}</version>
</dependency>
</dependencies>Viewing your metrics
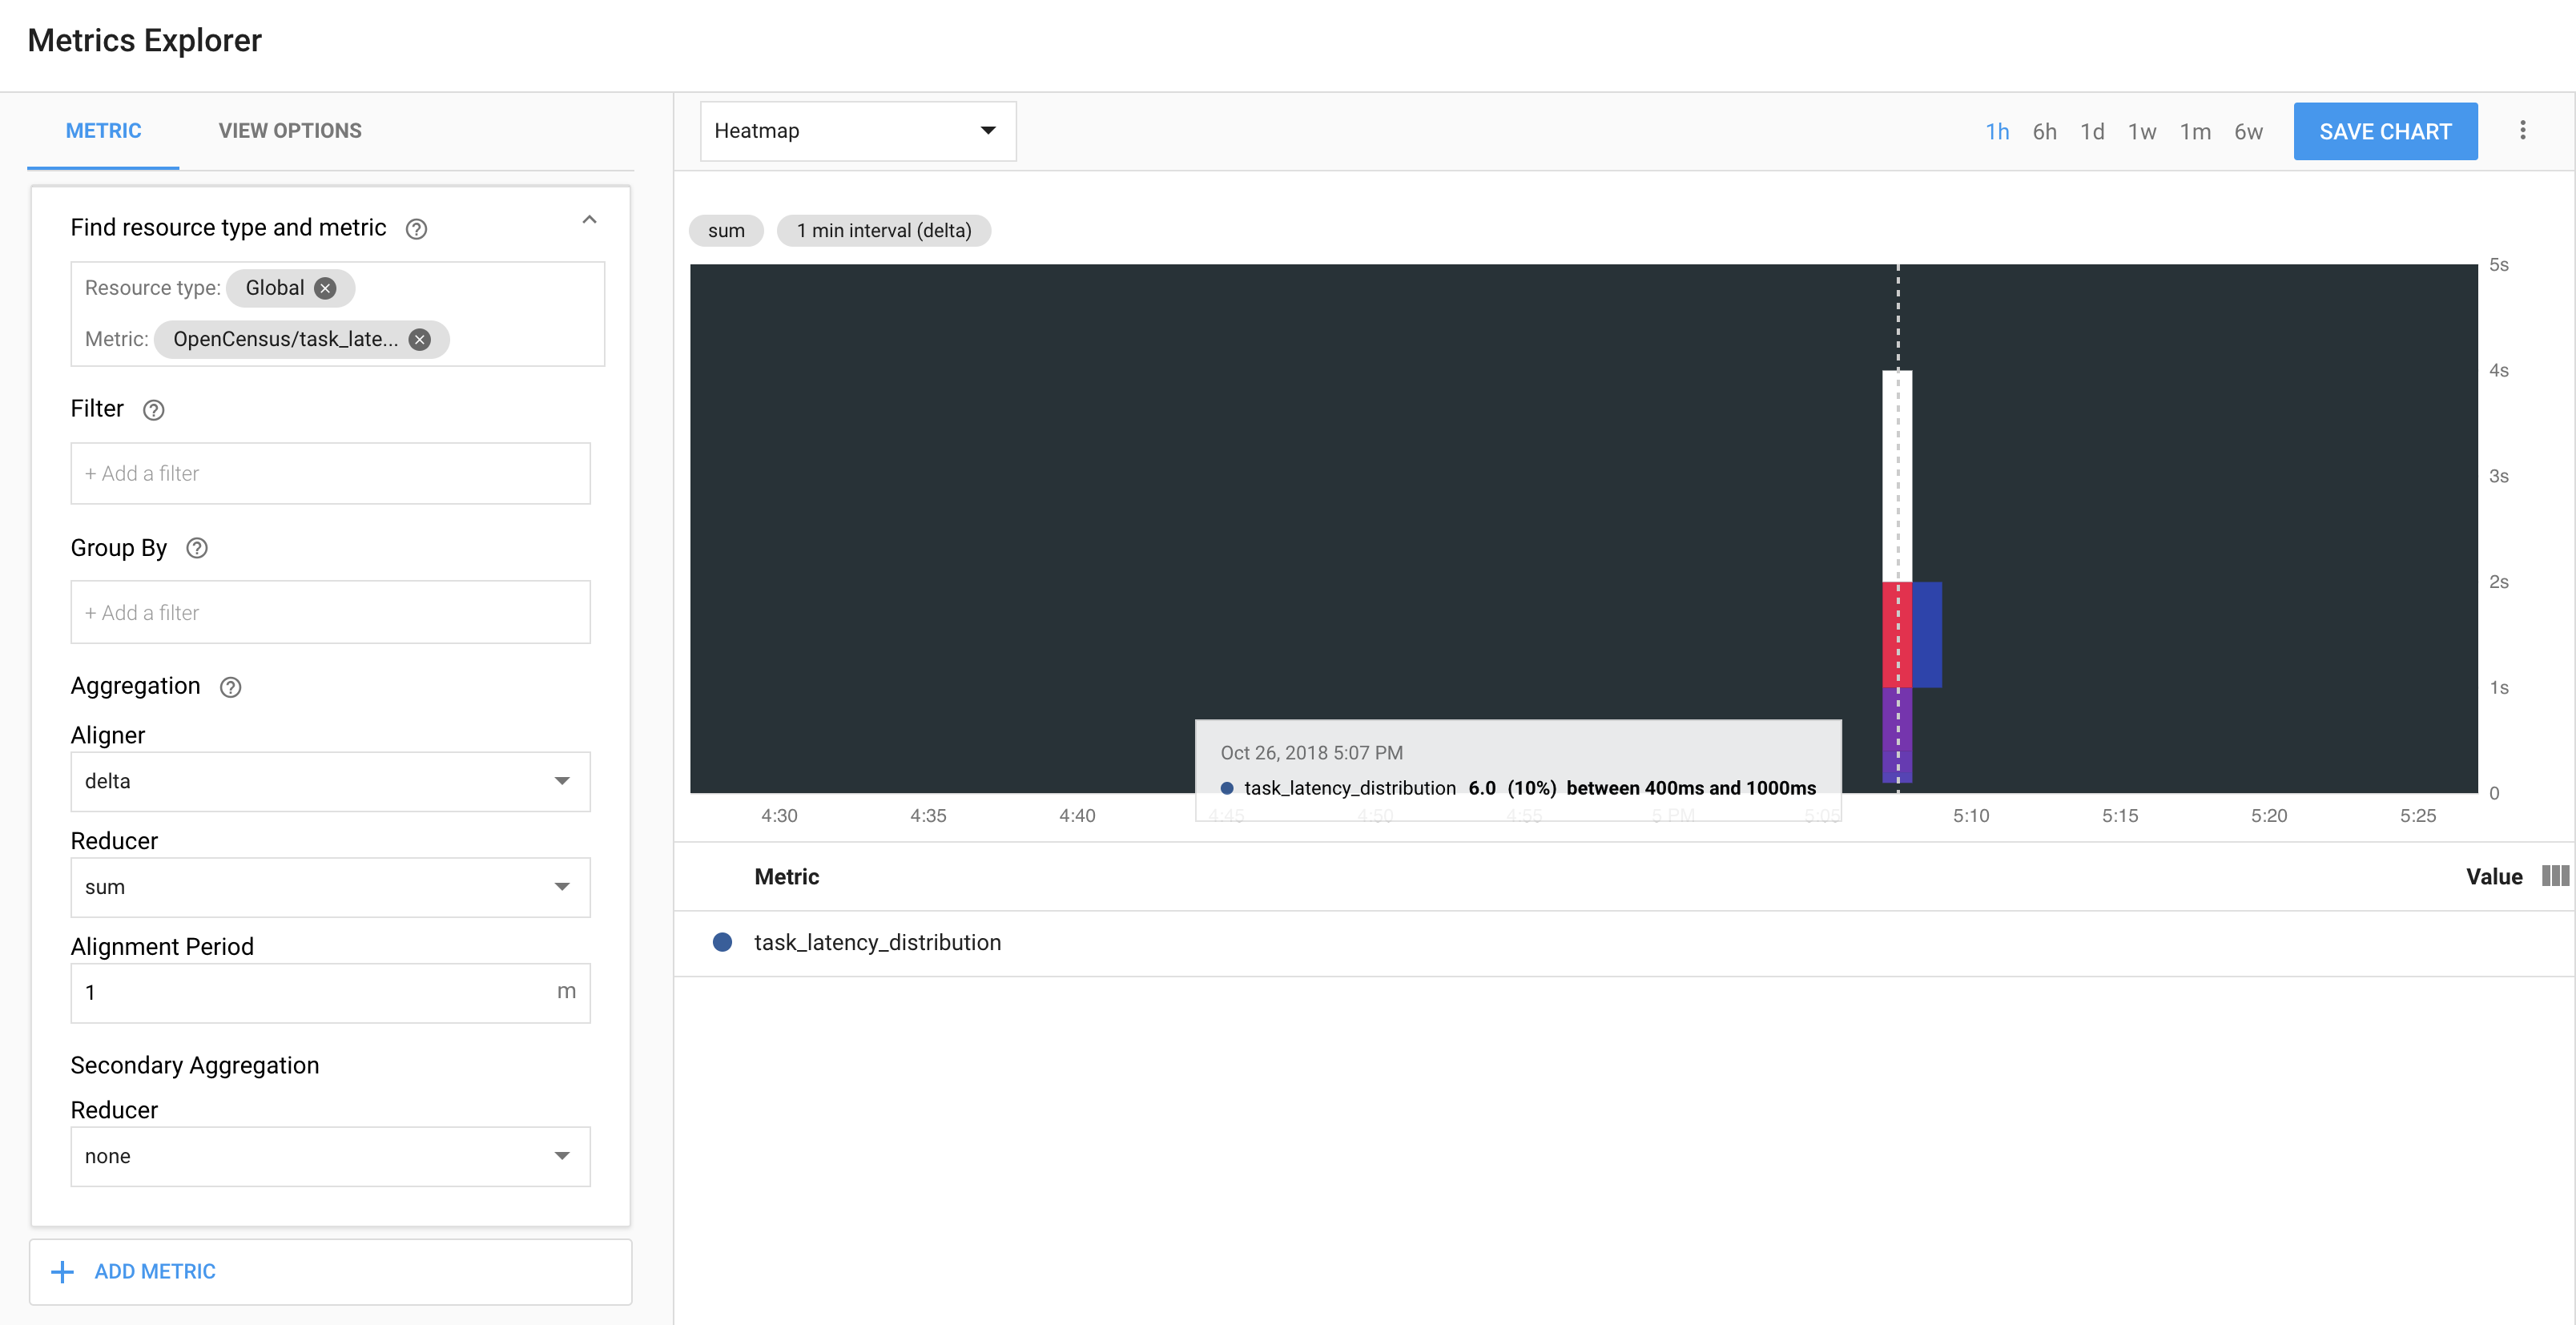
The program creates an OpenCensus view called task_latency_distribution. This string becomes part of the name of the metric when it is exported to Stackdriver Monitoring, so it can be used as a search string. The following screenshot shows the metric in Metrics Explorer:
 Each bar in the heatmap represents one run of the program, and the colored components of each bar represent part of the latency distribution.
Please visit https://console.cloud.google.com/monitoring
References
| Resource | URL |
|---|---|
| Setting up Stackdriver | Stackdriver Codelab |
| Stackdriver Java exporter | https://www.javadoc.io/doc/io.opencensus/opencensus-exporter-stats-stackdriver |
| OpenCensus Java Stats package | https://www.javadoc.io/doc/io.opencensus/opencensus-api/ |
