GoMemcache

- Introduction
- Features
- Using it
- Enabling OpenCensus
- End to end example
- Examining your traces
- Examining your metrics
- References
Introduction
Memcached is one of the most used server caching and scaling technologies.
It was created by Brad Fitzpatrick in 2003 as a solution to scale his social media product Live Journal
Features
Trace updates
OpenCensus Go was used to instrument Brad’s original Memcache client, with 2 major changes:
Set,Get,GetMulti,Add,Replace,Delete,DeleteAll,Decrement,CompareAndSwap,Touch,Each
all now take in a context.Context object as the first argument, to allow for trace propagation.
Available metrics
- Also a couple of metrics have been added:
| Metric | Name | Description | Tags |
|---|---|---|---|
| Distribution of key lengths | “gomemcache/key_length” | The distributions and counts of key lengths in Bytes | “method” |
| Distribution of value lengths | “gomemcache/value_length” | The distributions and counts of value lengths in Bytes | “method” |
| Distribution of latencies in milliseconds | “gomemcache/latency” | The distributions and counts of the various methods roundtrip latencies in milliseconds | “method”, “error”, “status” |
| Number of calls | “gomemcache/calls” | The number of calls of the various methods | “method”, “error”, “status” |
Using it
go get -u -v github.com/orijtech/gomemcache/memcacheEnabling OpenCensus
To provide observability we’ll enable OpenCensus tracing and metrics
Enabling Metrics
package main

import (
        "log"

        "go.opencensus.io/stats/view"

        "github.com/orijtech/gomemcache/memcache"
)

func main() {
        if err := view.Register(memcache.AllViews...); err != nil {
                log.Fatalf("Failed to register Memcache views: %v", err)
        }
}
Enabling Tracing
You’ll just to enable any of the trace exporter in Go exporters
End to end example
For assistance installing Memcached, please visit the Memcached Installation wiki
With Memcached now installed and running, we can now start the code sample and for simplicity examining metrics, we’ll use Stackdriver Monitoring and Tracing
For assistance setting up Stackdriver, please visit this Stackdriver setup guided codelab
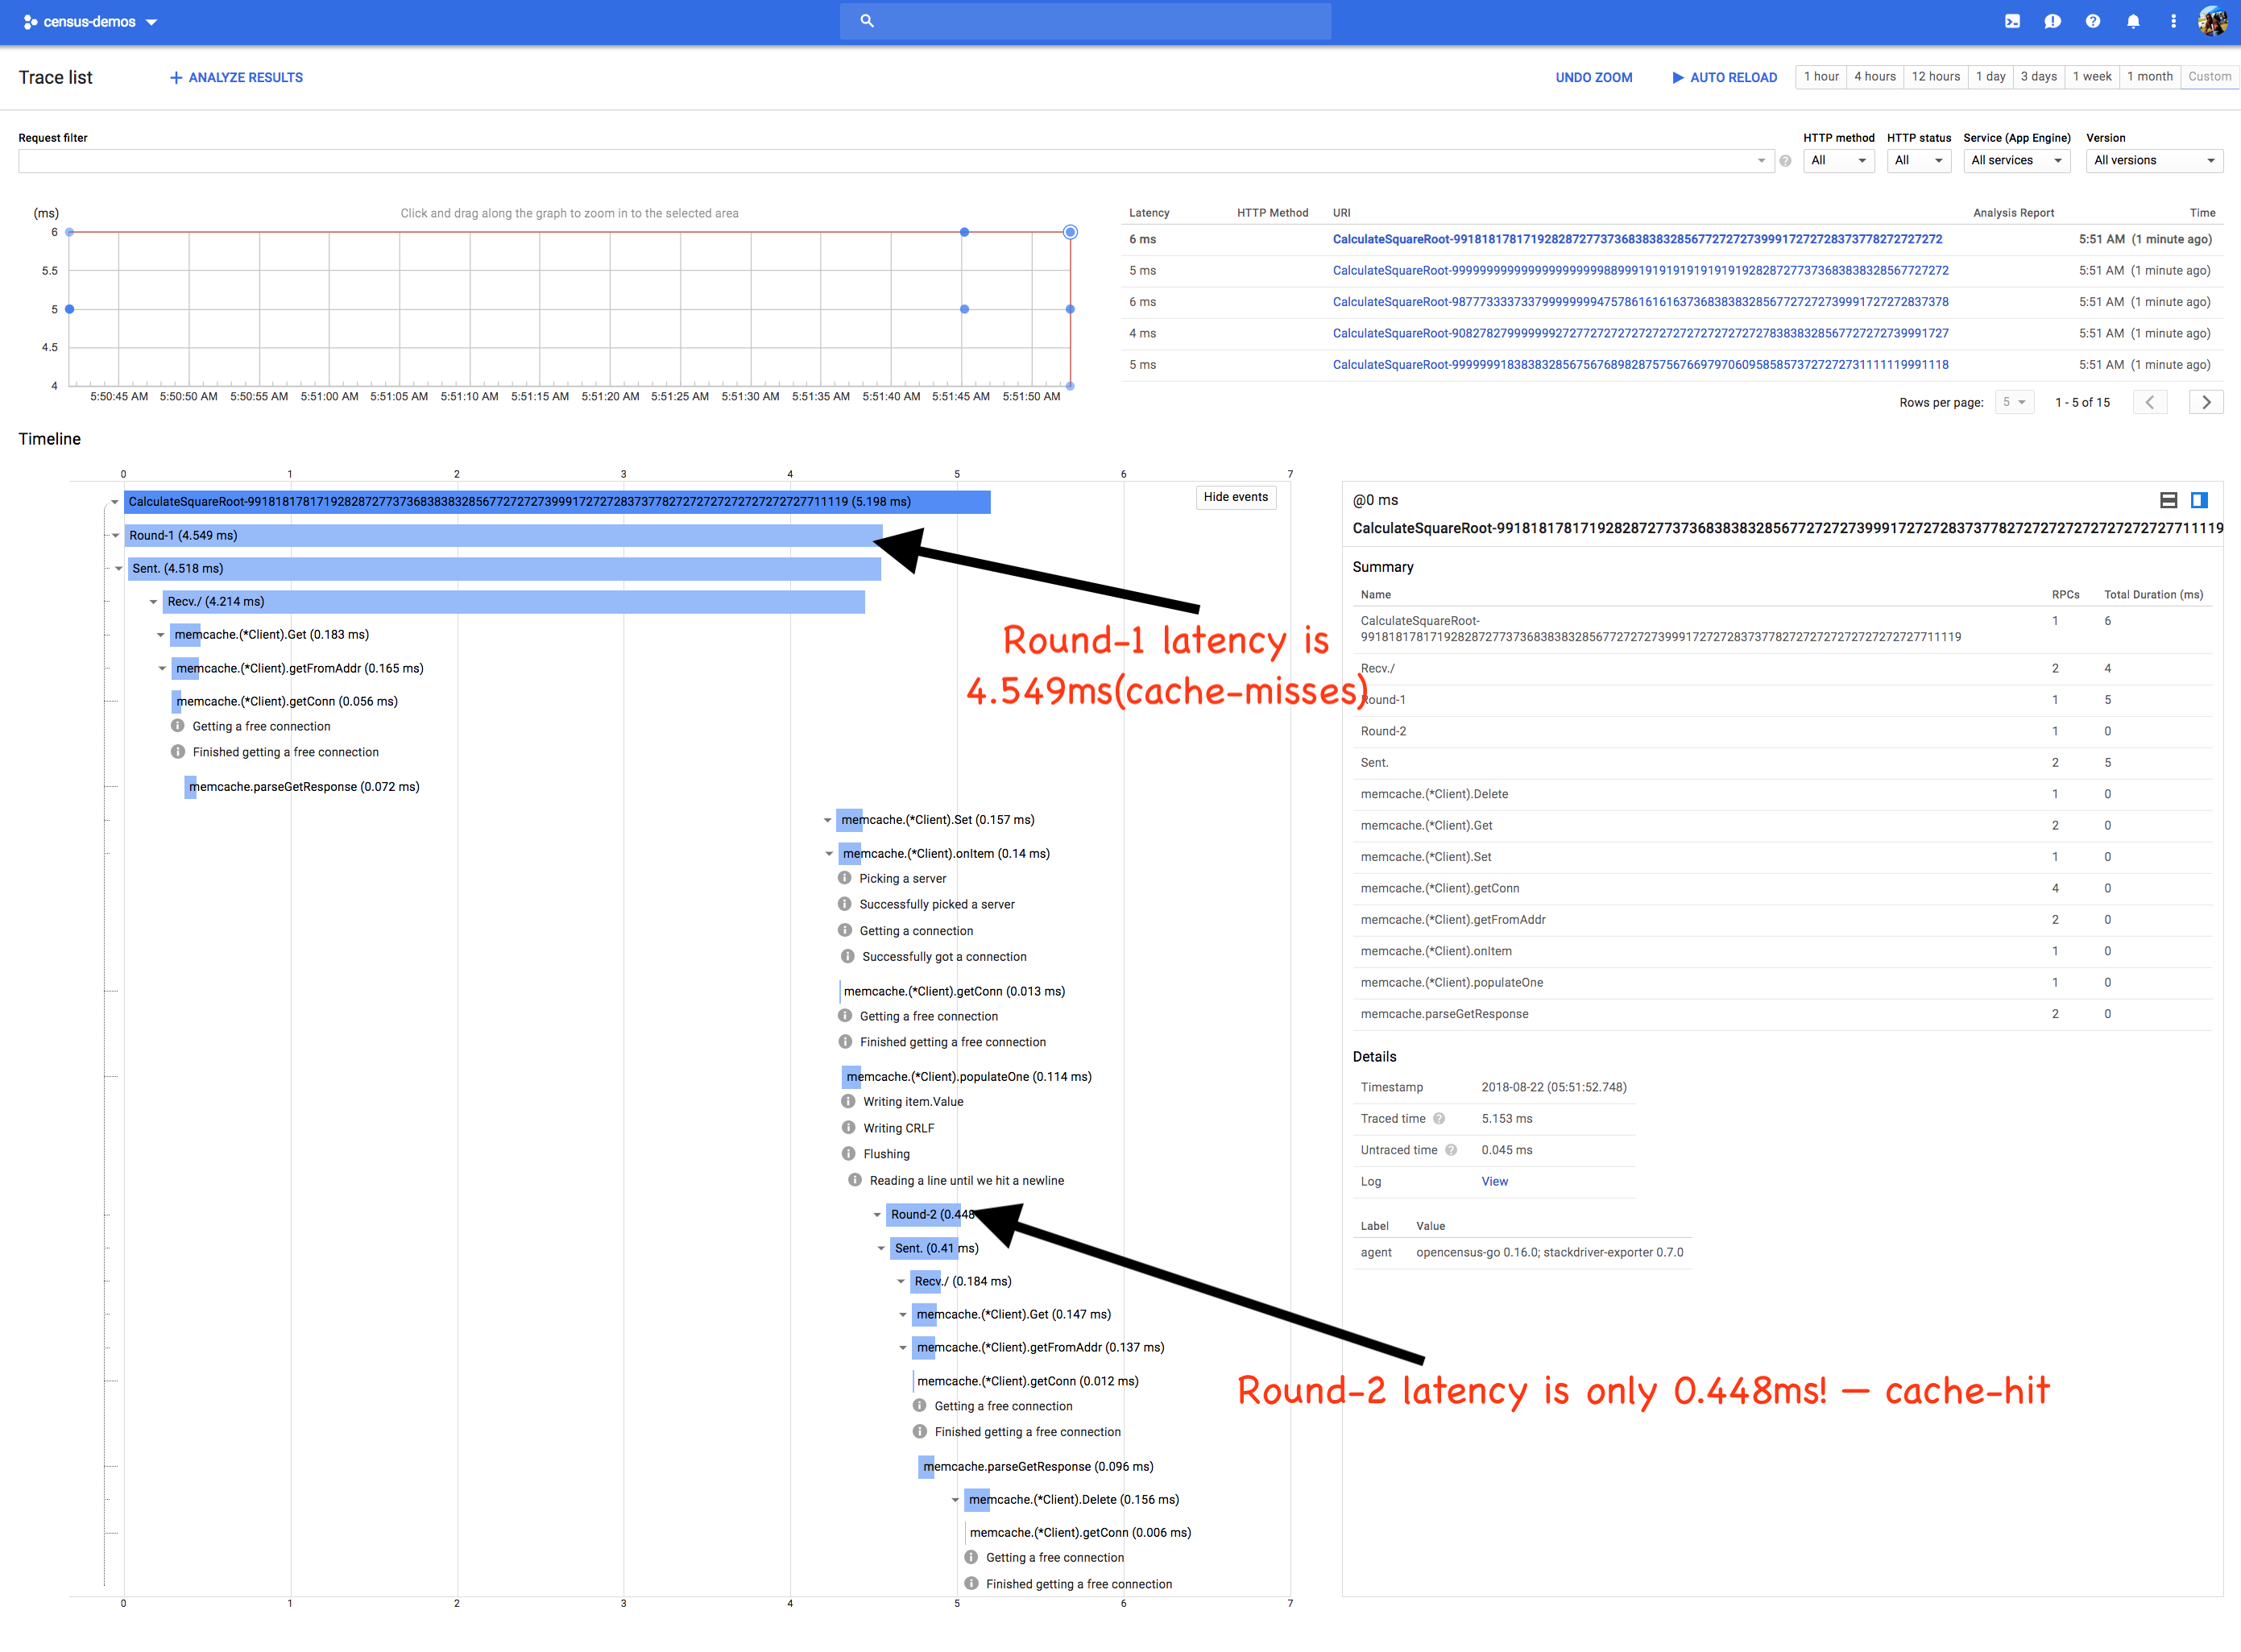
Our sample is an application excerpt from a distributed prime factorization engine that needs to calculate square roots of big numbers but would like to reuse expensively calculated results since square roots of such numbers are CPU intensive. To share/memoize results amongst our distributed applications, we’ll use Memcache. In the first round, before a cache hit, we’ll notice that the latency is high, but on cache hit the latency decreases dramatically.
package main

import (
	"context"
	"fmt"
	"io/ioutil"
	"log"
	"math/big"
	"math/rand"
	"net/http"
	"net/http/httptest"
	"time"

	"github.com/orijtech/gomemcache/memcache"

	"contrib.go.opencensus.io/exporter/stackdriver"
	"go.opencensus.io/plugin/ochttp"
	"go.opencensus.io/stats/view"
	"go.opencensus.io/trace"
)

func main() {
	flushFn, err := enableOpenCensusTracingAndMetrics()
	if err != nil {
		log.Fatalf("Failed to enable OpenCensus: %v", err)
	}
	defer func() {
		// Wait for 60 seconds before exiting to allow metrics to be flushed
		log.Println("Waiting for ~60s to allow metrics to be exported")
		time.Sleep(62 * time.Second)
		flushFn()
	}()

	mc := memcache.New("localhost:11211")
	log.SetFlags(0)

	cst := httptest.NewServer(&ochttp.Handler{
		Handler: http.HandlerFunc(func(w http.ResponseWriter, r *http.Request) {
			qv := r.URL.Query()
			query := qv.Get("v")

			ctx := r.Context()
			// Check Memcached if we've computed it before
			memoizedSQRT, err := mc.Get(ctx, query)
			if memoizedSQRT != nil && len(memoizedSQRT.Value) > 0 && err == nil {
				w.Write(memoizedSQRT.Value)
				return
			}

			// Now compute the expensive operation
			in, _, err := big.ParseFloat(query, 0, 1000, big.ToNearestEven)
			if err != nil {
				http.Error(w, err.Error(), http.StatusBadRequest)
				return
			}

			sqrt := big.NewFloat(0).Sqrt(in)
			out, _ := sqrt.MarshalText()

			// Pause for 3 milliseconds as a throttle to "avoid CPU saturation".
			time.Sleep(3 * time.Millisecond)
			// Lastly, memoize it for a cache hit next time
			_ = mc.Set(ctx, &memcache.Item{Key: query, Value: out})
			w.Write(out)
		}),
	})
	defer cst.Close()

	values := []string{
		"9999999183838328567567689828757567669797060958585737272727311111199911188888889953113",
		"9082782799999992727727272727272727272727272727838383285677272727399917272728373799422229",
		"987773333733799999999475786161616373683838328567727272739991727272837378888888881322229",
		"99999999999999999999998899919191919191919192828727737368383832856772727273999172727283737671626262269222848",
		"991818178171928287277373683838328567727272739991727272837377827272727272727272727711119",
	}
	hc := &http.Client{Transport: &ochttp.Transport{}}
	for _, value := range values {
		log.Printf("In %s\n", value)
		ctx, span := trace.StartSpan(context.Background(), "CalculateSquareRoot-"+value)
		for i := 0; i < 2; i++ {
			startTime := time.Now()
			cctx, sspan := trace.StartSpan(ctx, fmt.Sprintf("Round-%d", i+1))
			req, _ := http.NewRequest("GET", cst.URL+"?v="+value, nil)
			req = req.WithContext(cctx)
			res, err := hc.Do(req)
			if err != nil {
				sspan.End()
				log.Printf("i=#%d, value=%q err: %v", i, value, err)
				continue
			}
			sqrtBlob, _ := ioutil.ReadAll(res.Body)
			_ = res.Body.Close()
			sspan.End()
			log.Printf("Round #%d\nSQRT %q\nTimeSpent: %s\n\n", i, sqrtBlob, time.Since(startTime))
		}
		// For clean up, we'll try to remove all the "values" so that the results
		// can be repeatable to demonstrate the cache misses and cache hits.
		_ = mc.Delete(ctx, value)
		span.End()
		log.Println()
	}
}

func enableOpenCensusTracingAndMetrics() (func(), error) {
	sd, err := stackdriver.NewExporter(stackdriver.Options{
		// Please change these as needed.
		MetricPrefix: "demosqrtcache",
		ProjectID:    "census-demos",
	})
	if err != nil {
		return nil, err
	}

	// Enable tracing: for demo purposes, we'll always trace.
	trace.ApplyConfig(trace.Config{DefaultSampler: trace.AlwaysSample()})

	// Register as a tracing exporter.
	trace.RegisterExporter(sd)

	// Start metrics exporter.
	sd.StartMetricsExporter()

	// Most importantly register all the views for GoMemcache.
	if err := view.Register(memcache.AllViews...); err != nil {
		return nil, err
	}
	return sd.Flush, nil
}
Examining your traces
Please visit https://console.cloud.google.com/traces
Opening our console will produce something like
Examining your metrics
Please visit https://console.cloud.google.com/monitoring
Metrics list

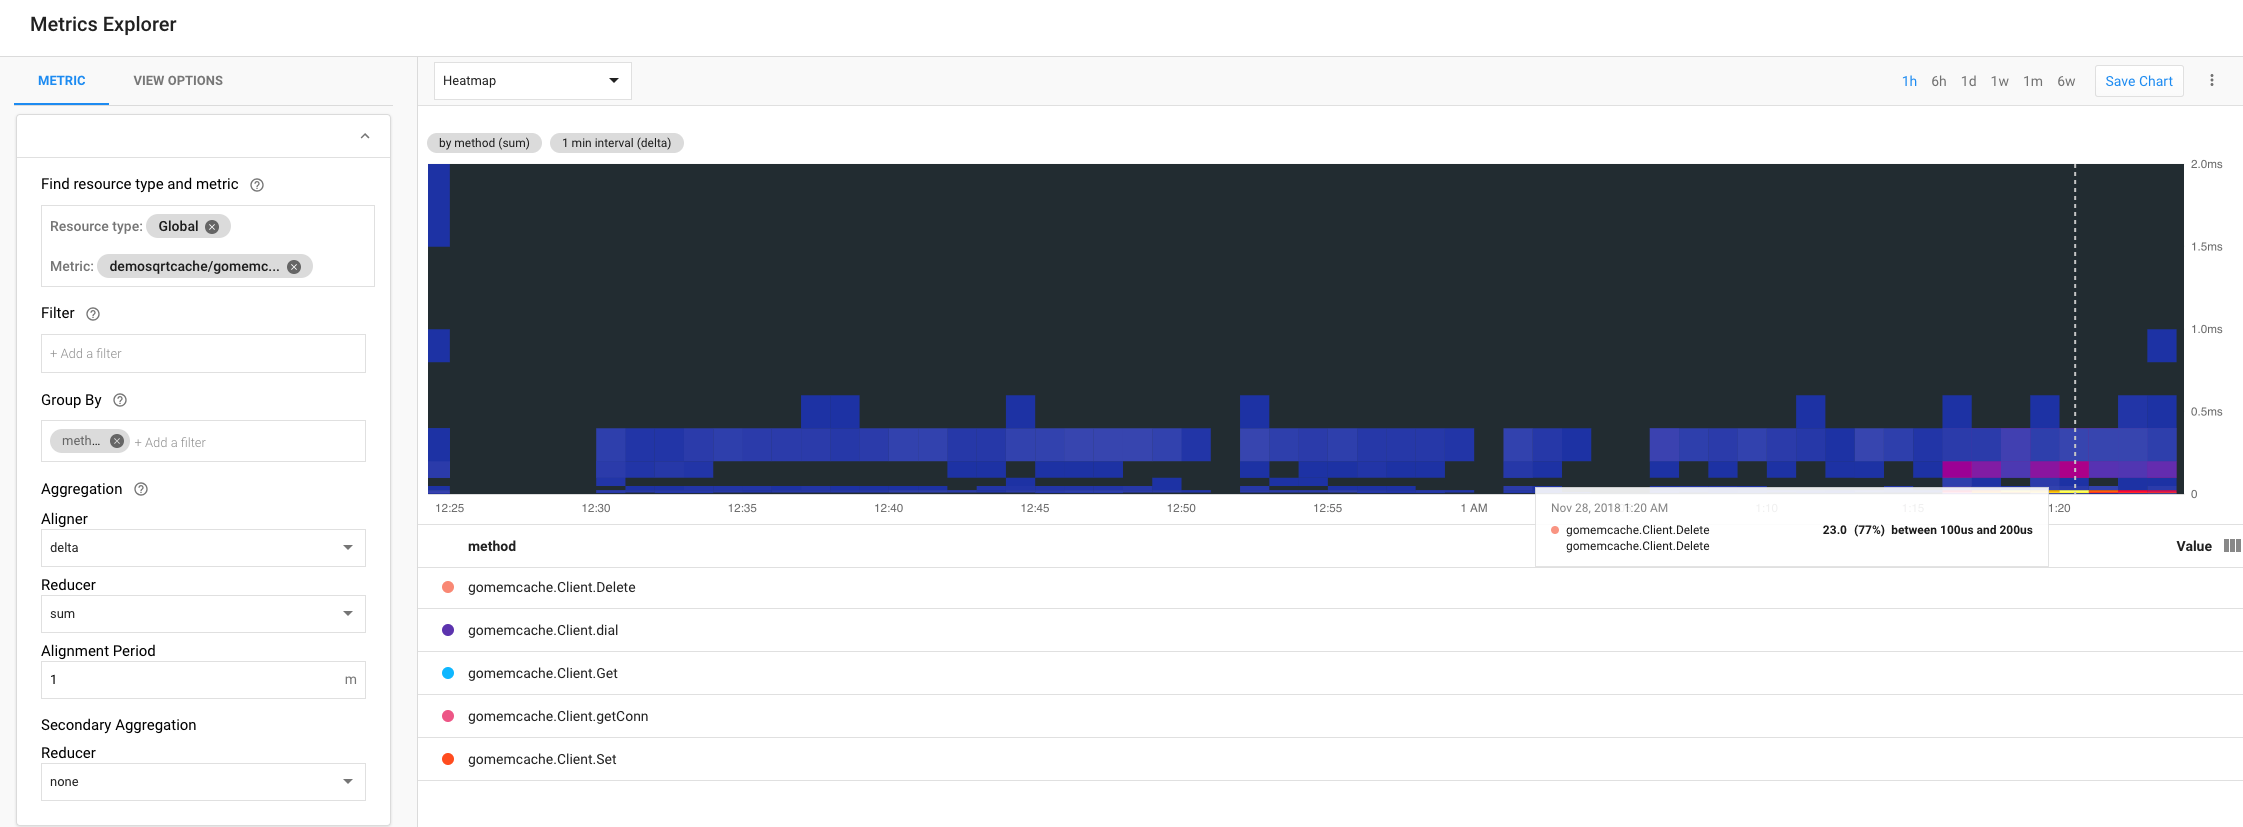
Latency heatmap
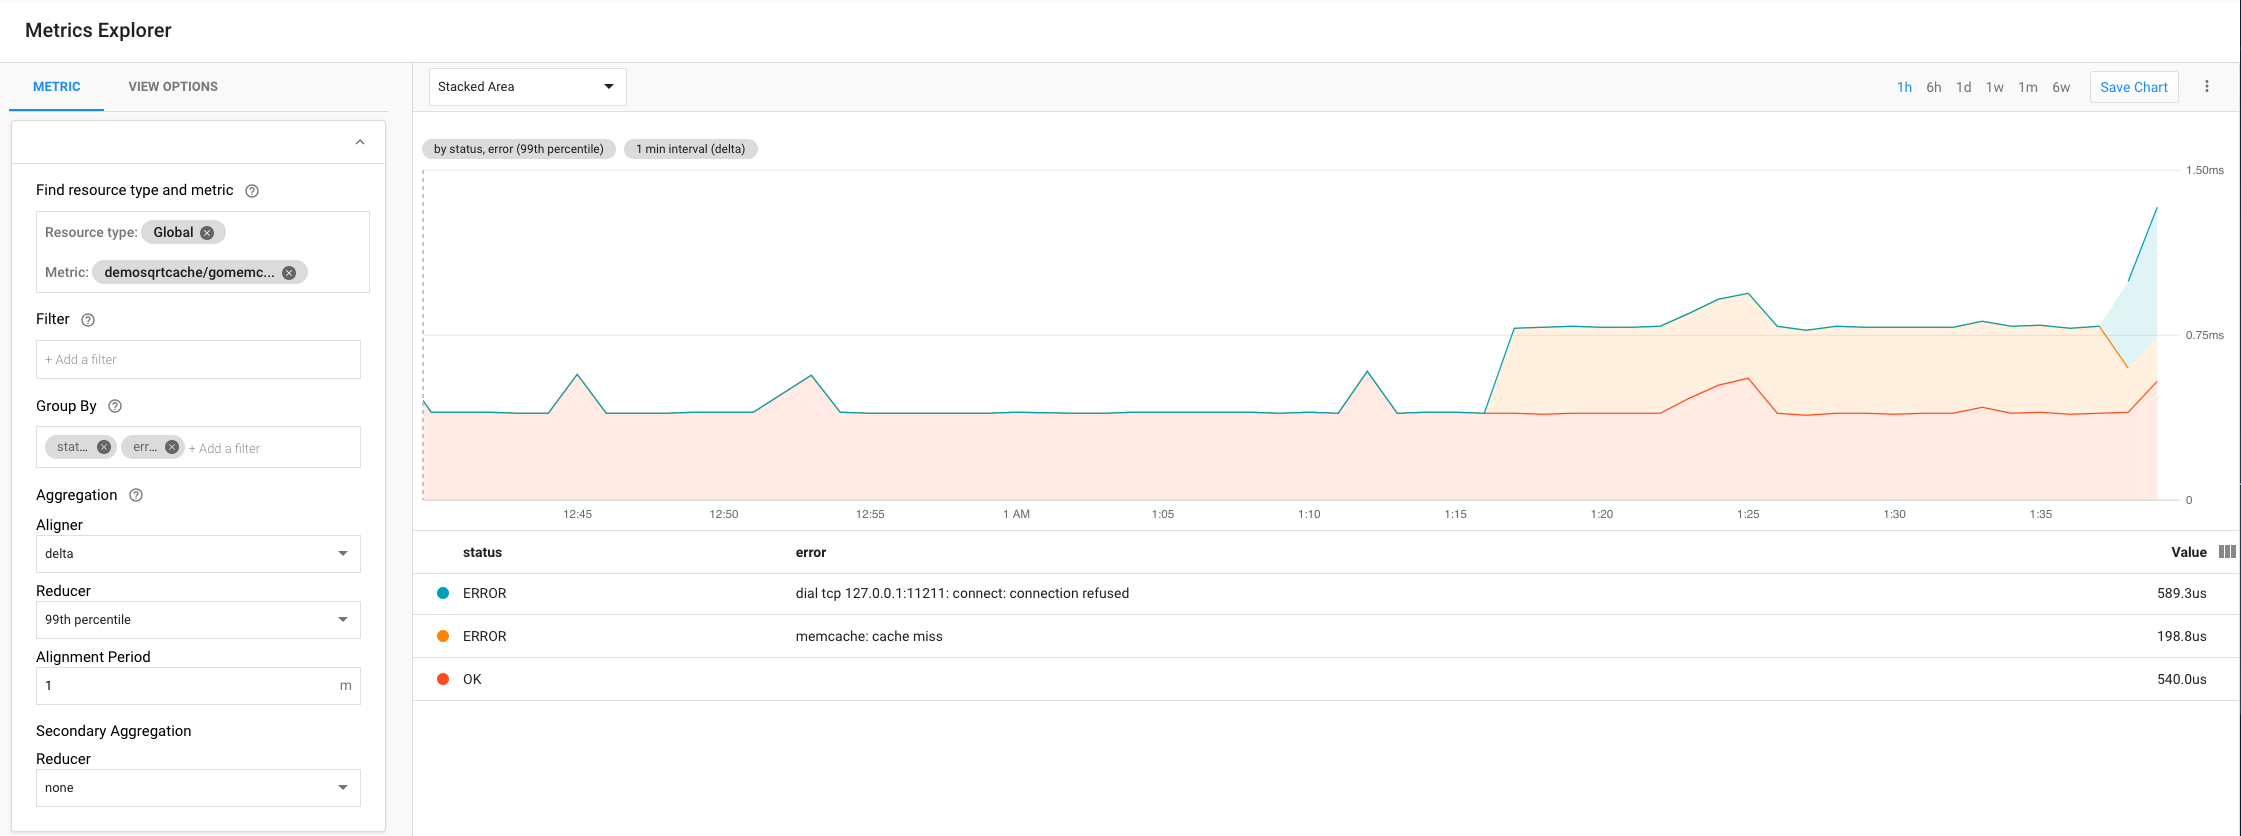
Latency stacked area, grouped by “status” and “error”
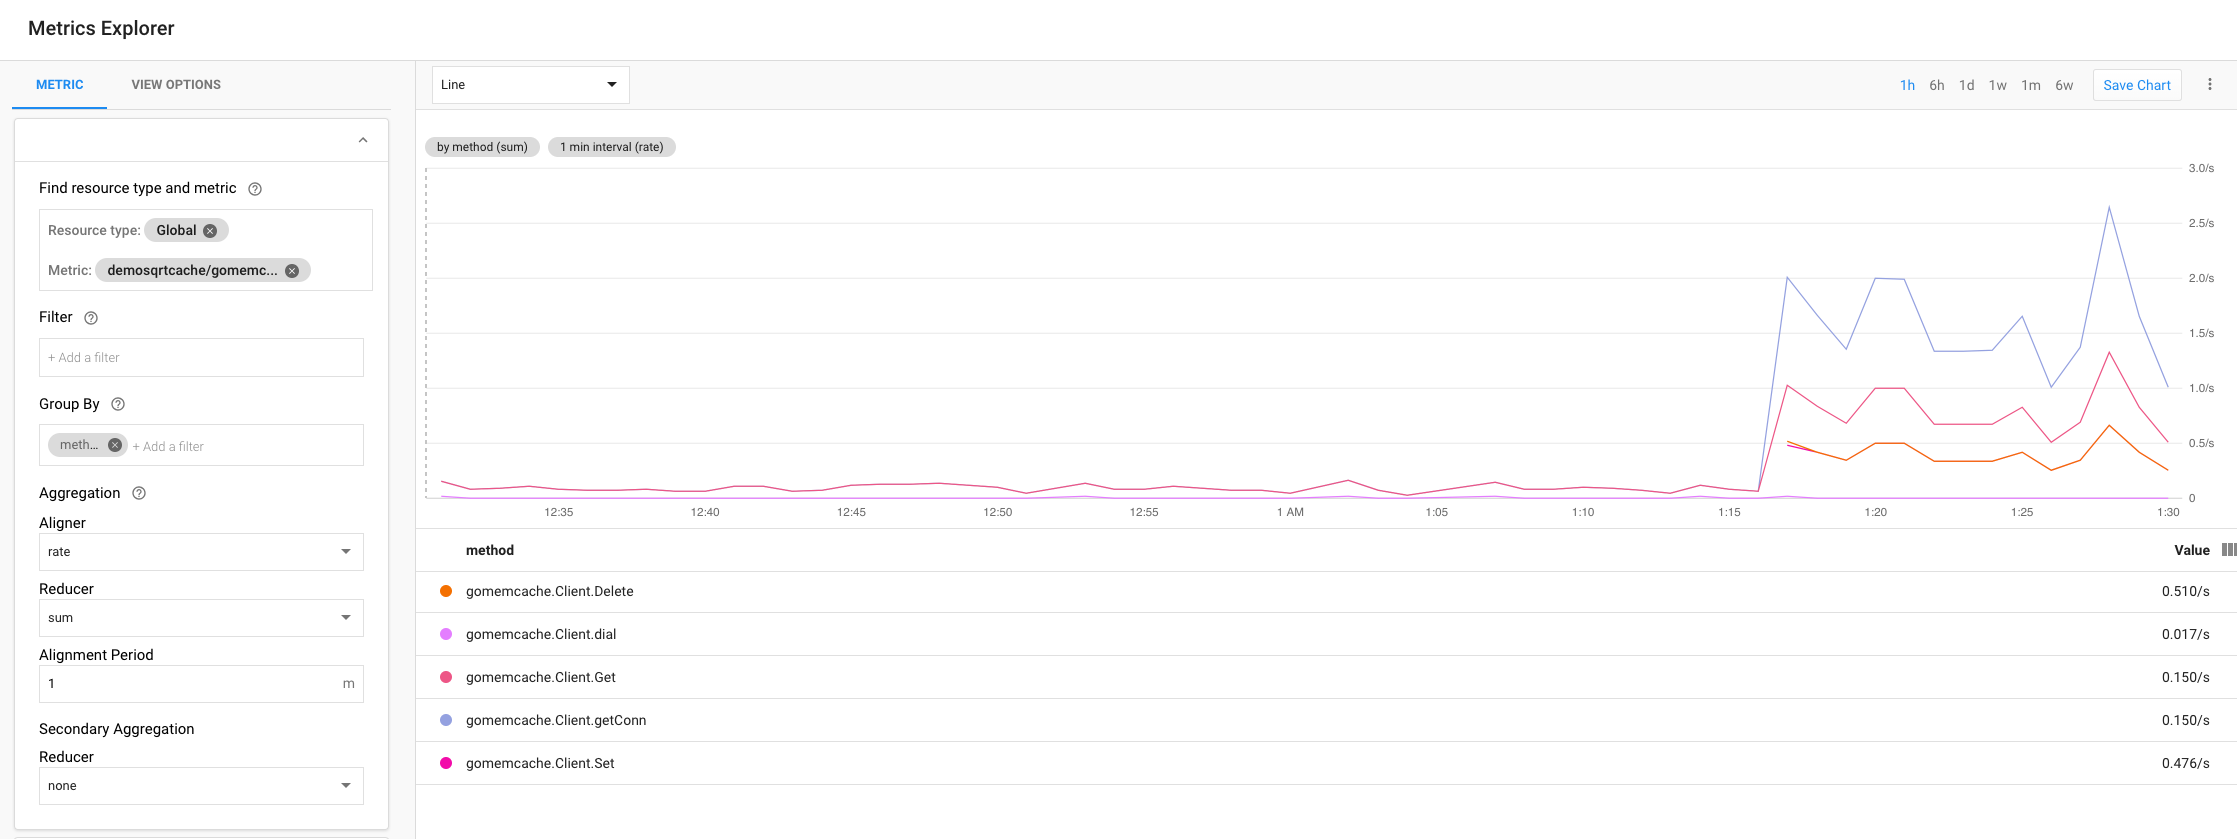
Calls grouped by “method”
Calls grouped by “status”
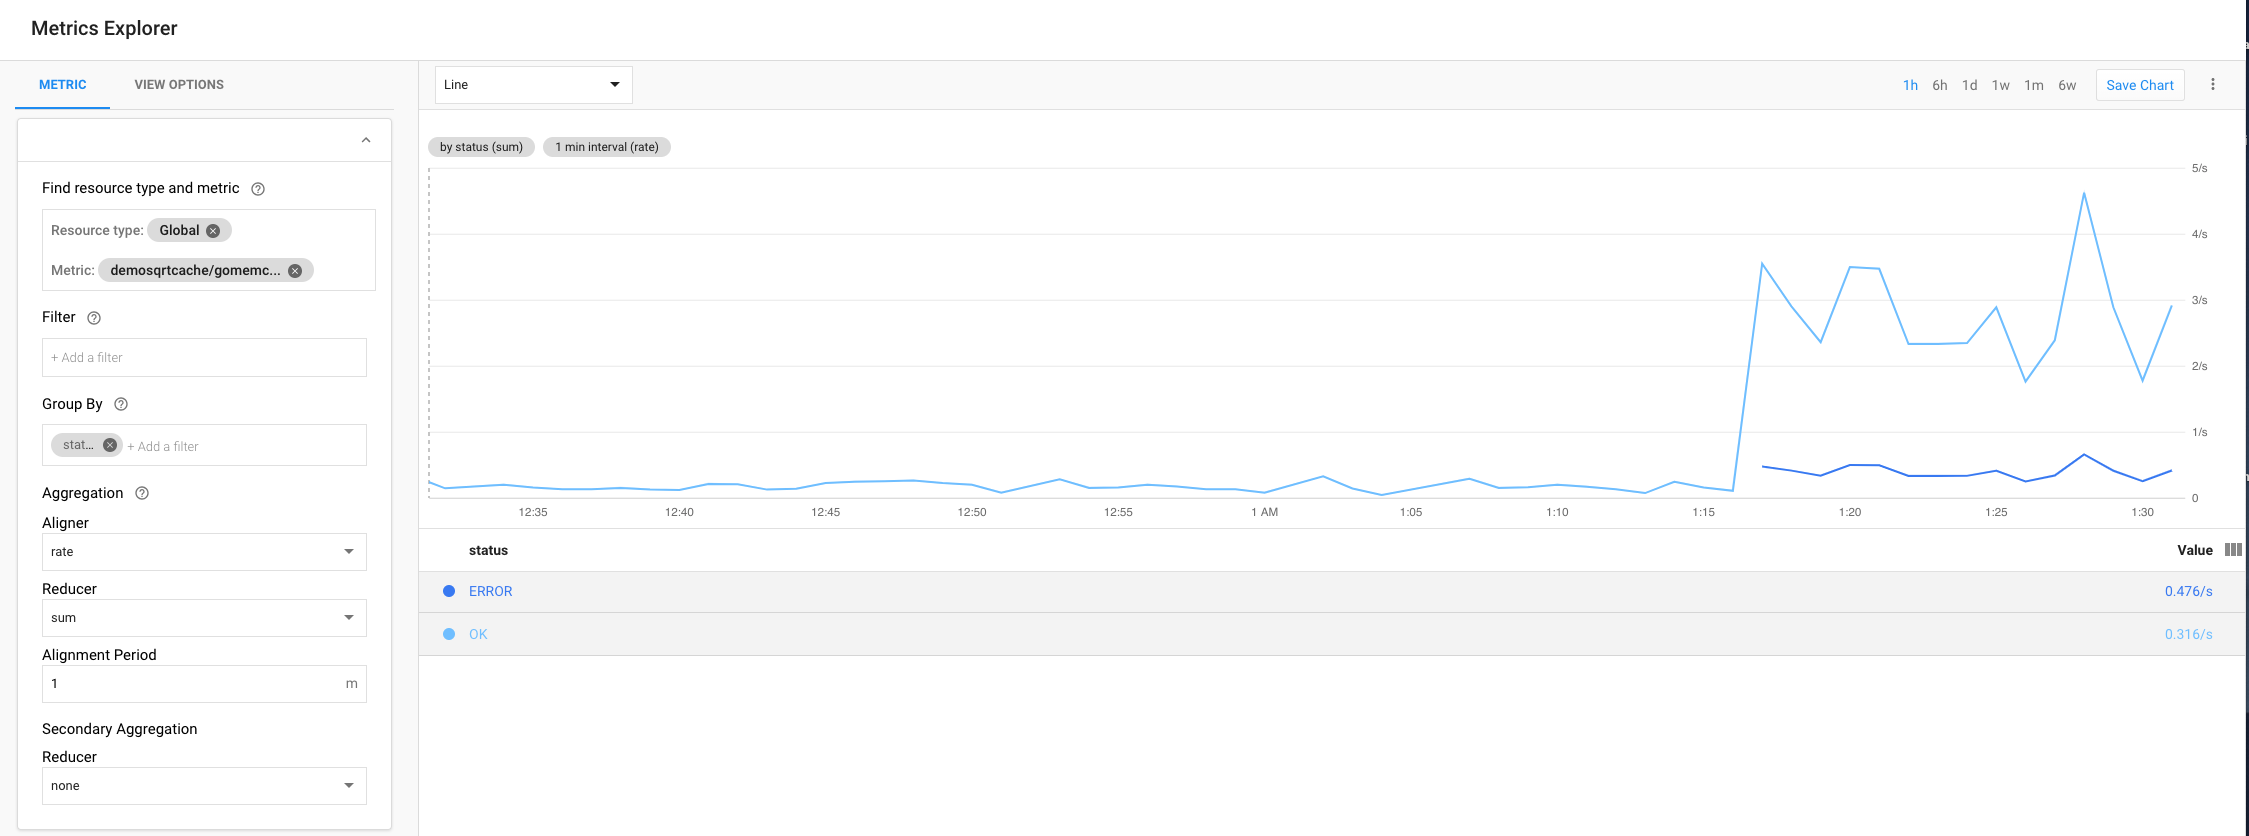
Value length stacked area
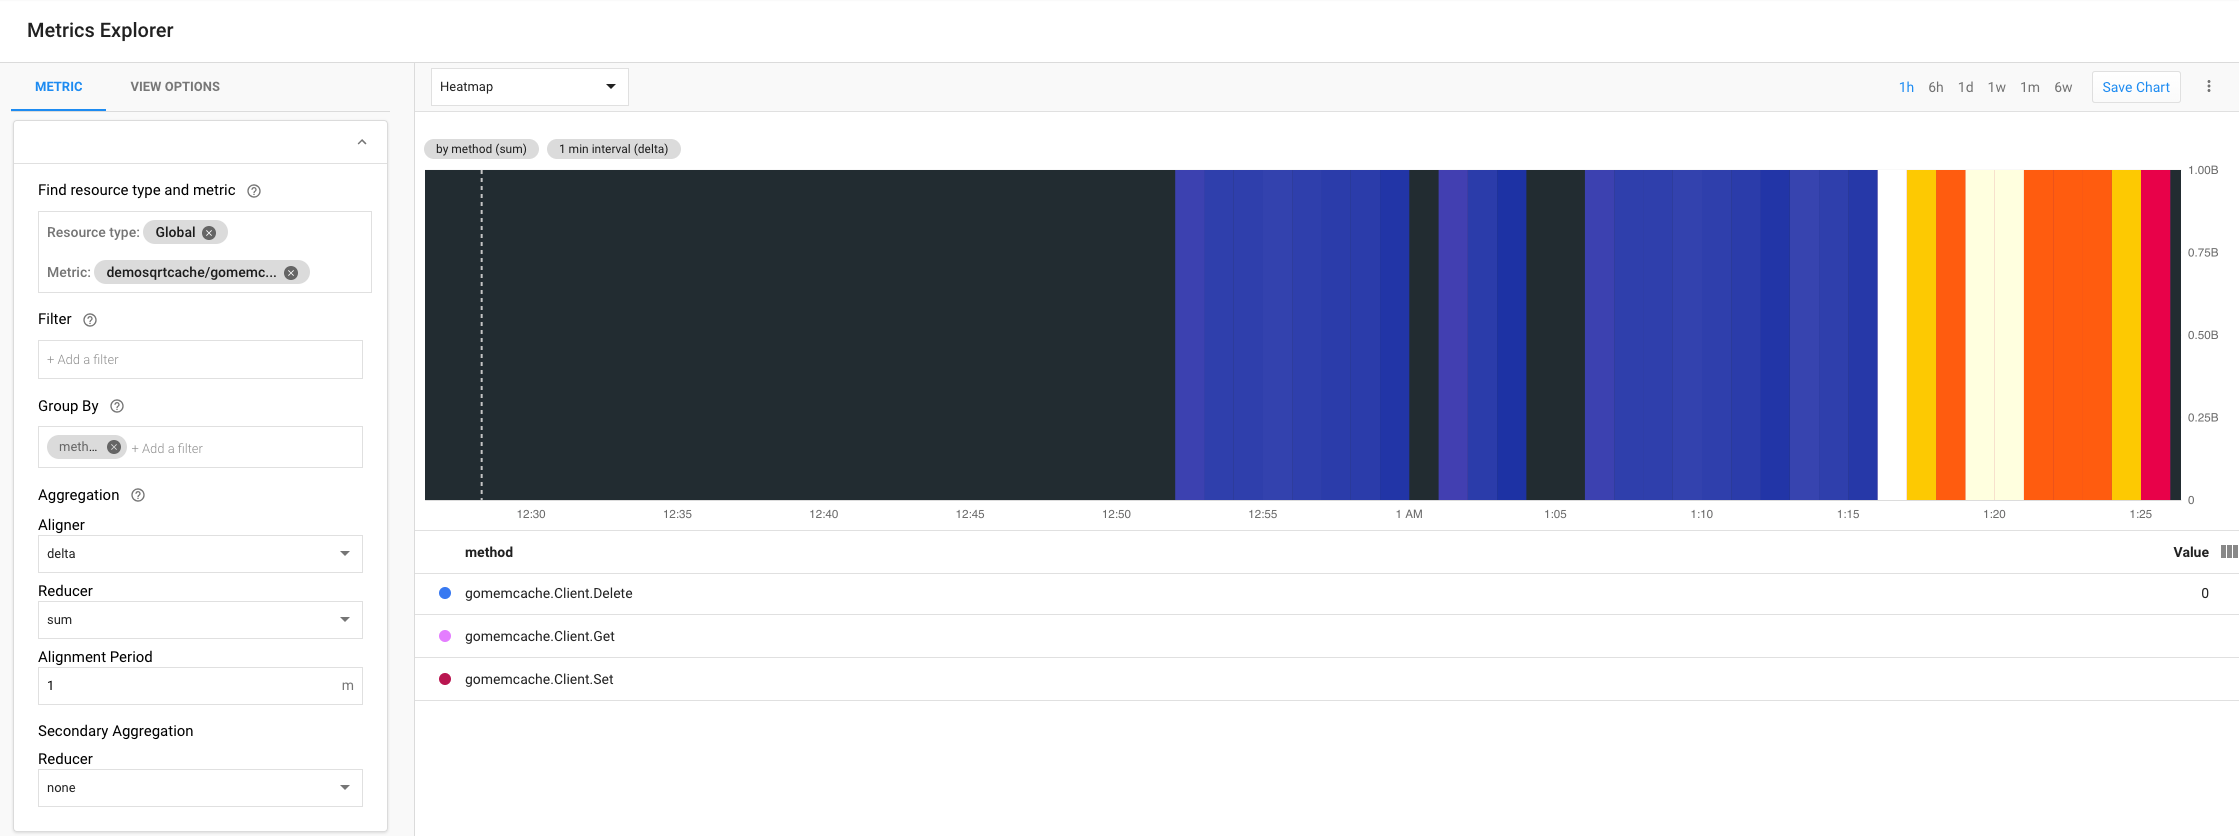
Key length heatmap
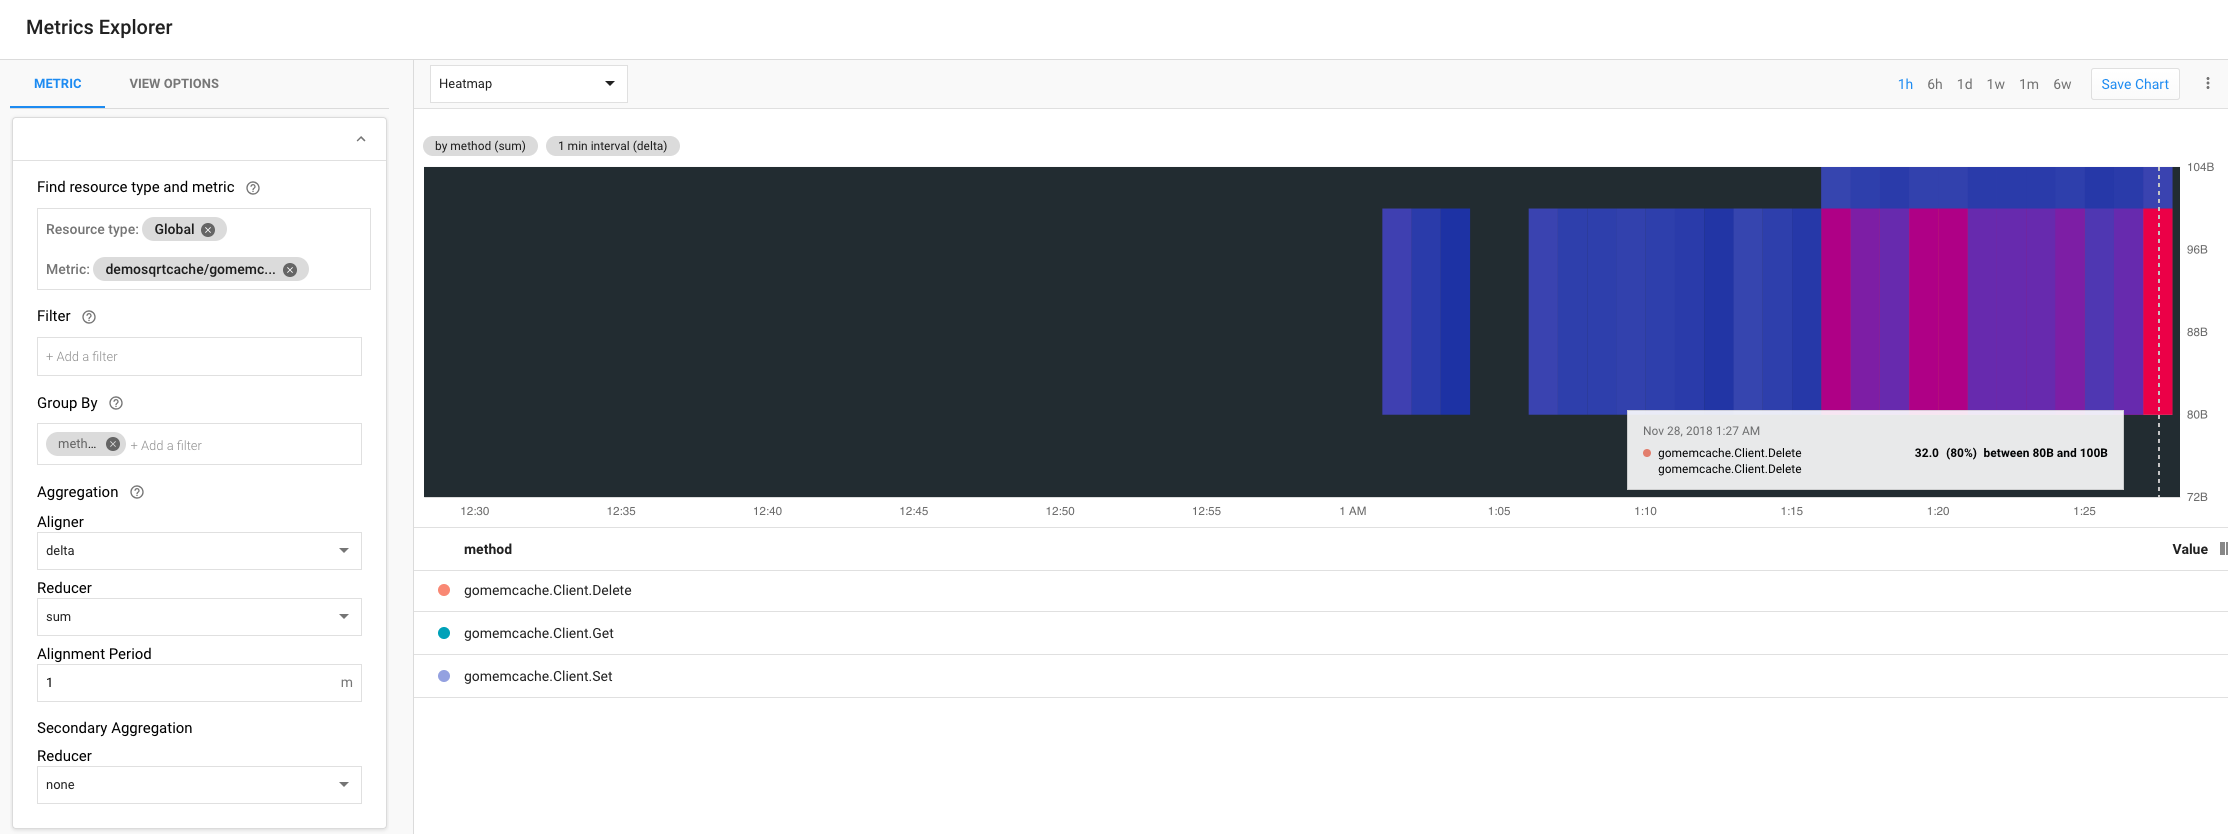
Key length stacked area
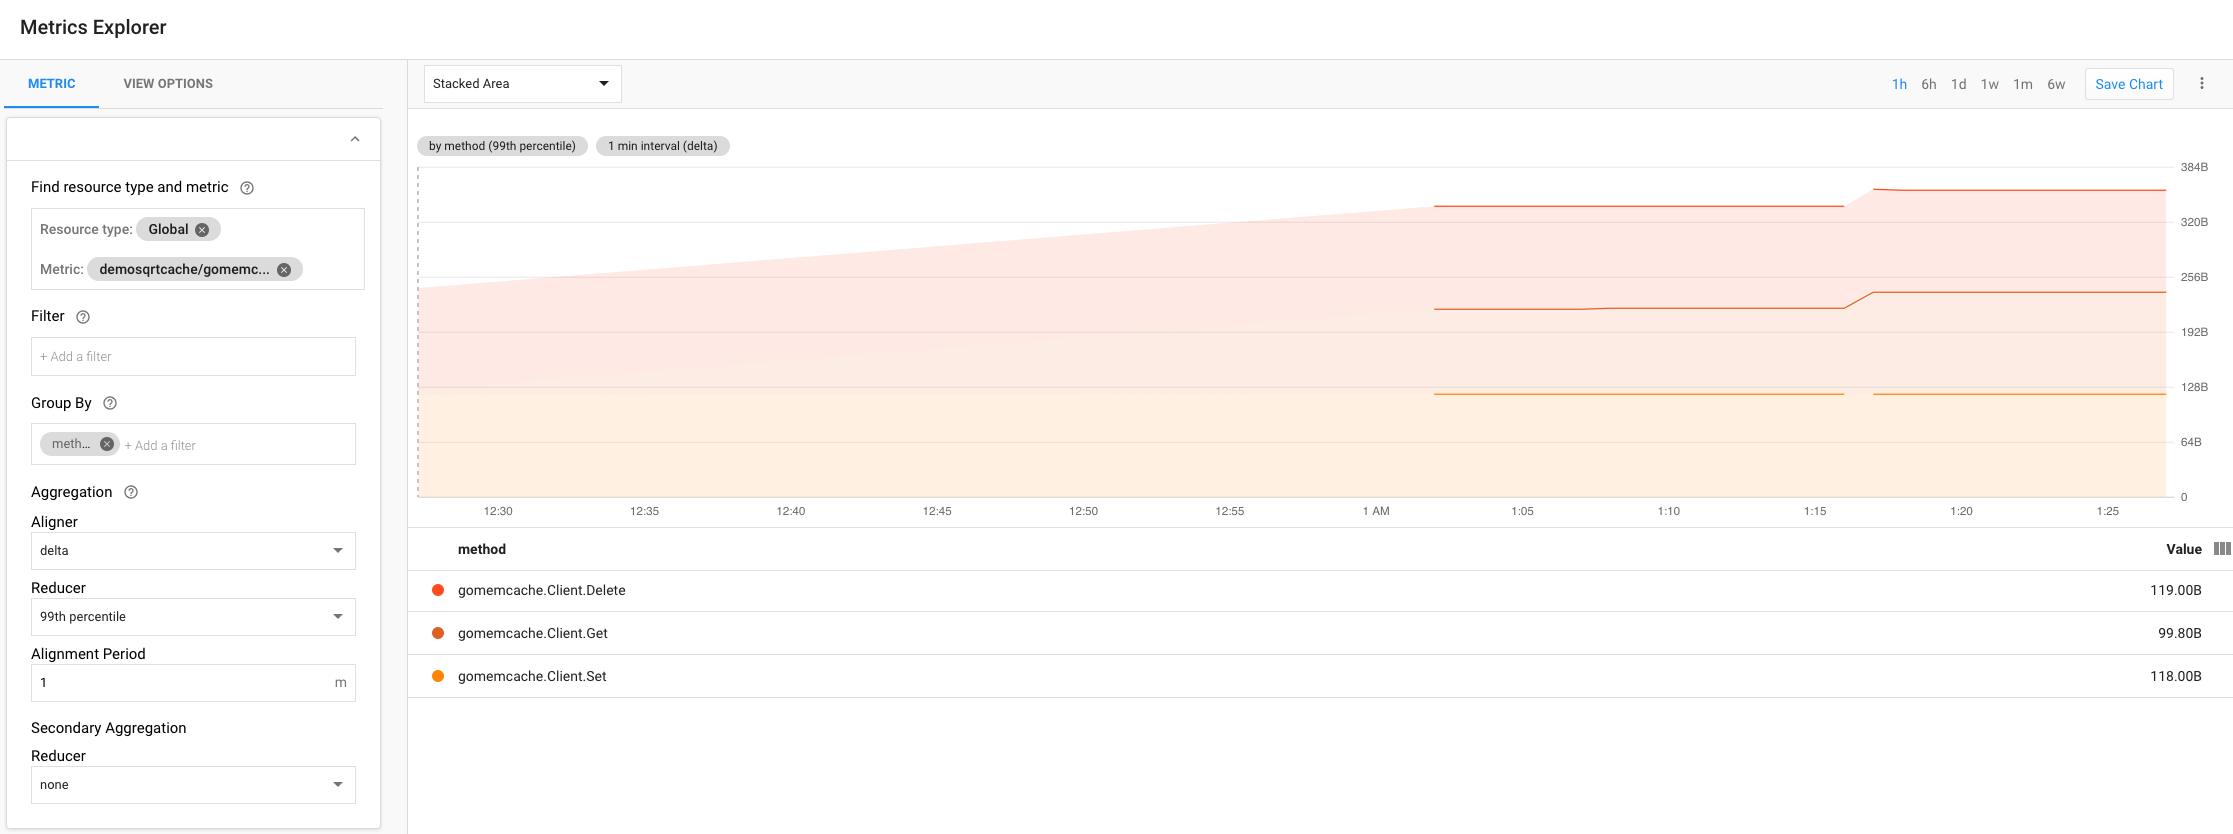
References
| Resource | URL |
|---|---|
| GoDoc | https://godoc.org/github.com/orijtech/gomemcache/memcache |
| Memcached clients instrumented with OpenCensus in Go and Python | Medium article |
