redis-py

- Introduction
- Prerequisites
- Installing it
- Instrumentation
- Metrics available
- Traces
- Enabling metrics
- End-to-end-example
- Examining traces
- Examining metrics
- Notes
- References
Introduction
ocredis is an OpenCensus instrumented wrapper for Andy McCurdy’s popular Python Redis client redis-py
ocredis is a drop-in replacement for redis-py (which it uses underneath) and for each method that performs a network call, it creates a span and collects metrics such as latency, errors, key lengths, value lengths.
To demonstrate how much of a drop-in replacement it is for redis-py, from the getting started guide in the redis-py README
>>> import redis
>>> r = redis.Redis(host='localhost', port=6379, db=0)
>>> r.set('foo', 'bar')
True
>>> r.get('foo')
'bar'
you can now instead just do this
>>> import ocredis
>>> r = ocredis.OcRedis(host='localhost', port=6379, db=0)
>>> r.set('foo', 'bar')
True
>>> r.get('foo')
'bar'
which is almost identical to the original statement as seen by this diff below.
1,2c1,2
< >>> import redis
< >>> r = redis.Redis(host='localhost', port=6379, db=0)
---
> >>> import ocredis
> >>> r = ocredis.OcRedis(host='localhost', port=6379, db=0)
Prerequisites
You will need the following:
- Redis server
- Prometheus
- Zipkin
Before proceeding we’ll need to firstly install the following
| Requirement | Guide |
|---|---|
| Redis server | https://redis.io/topics/quickstart |
| Prometheus | Prometheus codelab |
| Zipkin | Zipkin codelab |
Installing it
ocredis is available on PyPi at https://pypi.org/project/ocredis/ and can be installed simply by running:
pip install ocredisInstrumentation
ocredis provides both traces and metrics per method that invokes the network.
Traces
Each method is traced and on any exception, the underlying span.Status will be set to indicate the error.
Metrics
Using OpenCensus, the following metrics are present
| Metric | Search suffix | Unit | Aggregation | Tags |
|---|---|---|---|---|
| Latency | redispy/latency | ms | Distribution | “error”, “method”, “status” |
| Calls | redispy/calls | 1 | Count | “error”, “method”, “status” |
| Key lengths | redispy/key_length | By | Distribution | “error”, “method”, “status” |
| Value lengths | redispy/value_length | By | Distribution | “error”, “method”, “status” |
Enabling observability
After enabling one of the Python exporters, please don’t forget to add
ocredis.register_views()End to end example
In the example below, we’ll have a CLI app that:
- Reads input from standard input:
- Checks Redis if that phrase was already cached. If so deletes it from Redis
- If the phrase wasn’t already cached, process it by capitalization and then save it to Redis
- Exports traces to Zipkin
- Exports metrics to Prometheus
Source code
#!/usr/bin/env python

import ocredis

from opencensus.trace.tracer import Tracer
from opencensus.trace.exporters.zipkin_exporter import ZipkinExporter
from opencensus.trace.samplers import always_on
from opencensus.common.transports import async_
from opencensus.stats import stats
from opencensus.stats.exporters import prometheus_exporter as prometheus

def create_opencensus_exporters_and_tracer():
    # Create the Prometheus metrics exporter.
    statsm = stats.Stats()
    view_manager = statsm.view_manager
    pexp = prometheus.new_stats_exporter(prometheus.Options(namespace='ocredispy', port=8000))
    view_manager.register_exporter(pexp)

    # Register the defined ocredis views.
    ocredis.register_views()

    # Create the exporter that'll upload our traces to Zipkin.
    zexp = ZipkinExporter(service_name='pysearch', transport=async_.AsyncTransport)

    tracer_init_args = dict(exporter=zexp,
            # Always sampling for demo purposes.
            sampler=always_on.AlwaysOnSampler())

    return tracer_init_args

def main():
    r = ocredis.OcRedis(host='localhost', port=6379, db=10)
    tracer_init_args = create_opencensus_exporters_and_tracer()
    while True:
        try:
            query = raw_input('$ ')
            response = do_search(r, query, **tracer_init_args)
            print('> ' + response + '\n')
        except Exception as e:
            print('Caught exception %s'%(e))
        except KeyboardInterrupt as e:
            print('Bye')
            return

def do_search(client, query, **tracer_init_kwargs):
    tracer = Tracer(**tracer_init_kwargs)
    with tracer.span('Search') as span:
        span.add_annotation('Searching', query=query)

        # Check Redis if we've already memoized the response.
        response = client.get(query)

        if response is not None: # Cache hit
            span.add_annotation('Cache hit', store='redis', client='redis-py')
            print('Cache hit! Now deleting it to make for a cache miss later')
            # Clear the response so that the next search will return a cache-miss.
            client.delete(query)

        else:  # Cache miss
            span.add_annotation('Cache miss', store='redis', client='redis-py')
            print('Cache miss! Now processing and memoizing it to make for a cache hit later')

            # Now process the result and memoize it.
            response = query.upper()
            client.set(query, response)

        span.finish()
        return response

if __name__ == '__main__':
    main()
Running the code
Having started Redis-Server, we can now get the code running.
In a fresh Python shell, we can run
python main.pywhich after such keyboard inputs, should produce such output
$ ./main.py
No handlers could be found for logger "opencensus.stats.aggregation"
$ what is this
Cache miss! Now processing and memoizing it to make for a cache hit later
> WHAT IS THIS

$ what is that
Cache miss! Now processing and memoizing it to make for a cache hit later
> WHAT IS THAT

$ what is this
Cache hit! Now deleting it to make for a cache miss later
> WHAT IS THIS

$
Running Zipkin
Please check out this guide for how to install and start Zipkin.
Running Prometheus
Please check out this guide for how to install and start Prometheus.
We shall use the Prometheus configuration file below, saved as prom.yaml
# Saved as prom.yaml
scrape_configs:
  - job_name: 'pysearch'

    scrape_interval: 5s
    static_configs:
       - targets: ['localhost:8000']
and finally start Prometheus like this:
prometheus --config.file=prom.yamlExamining traces
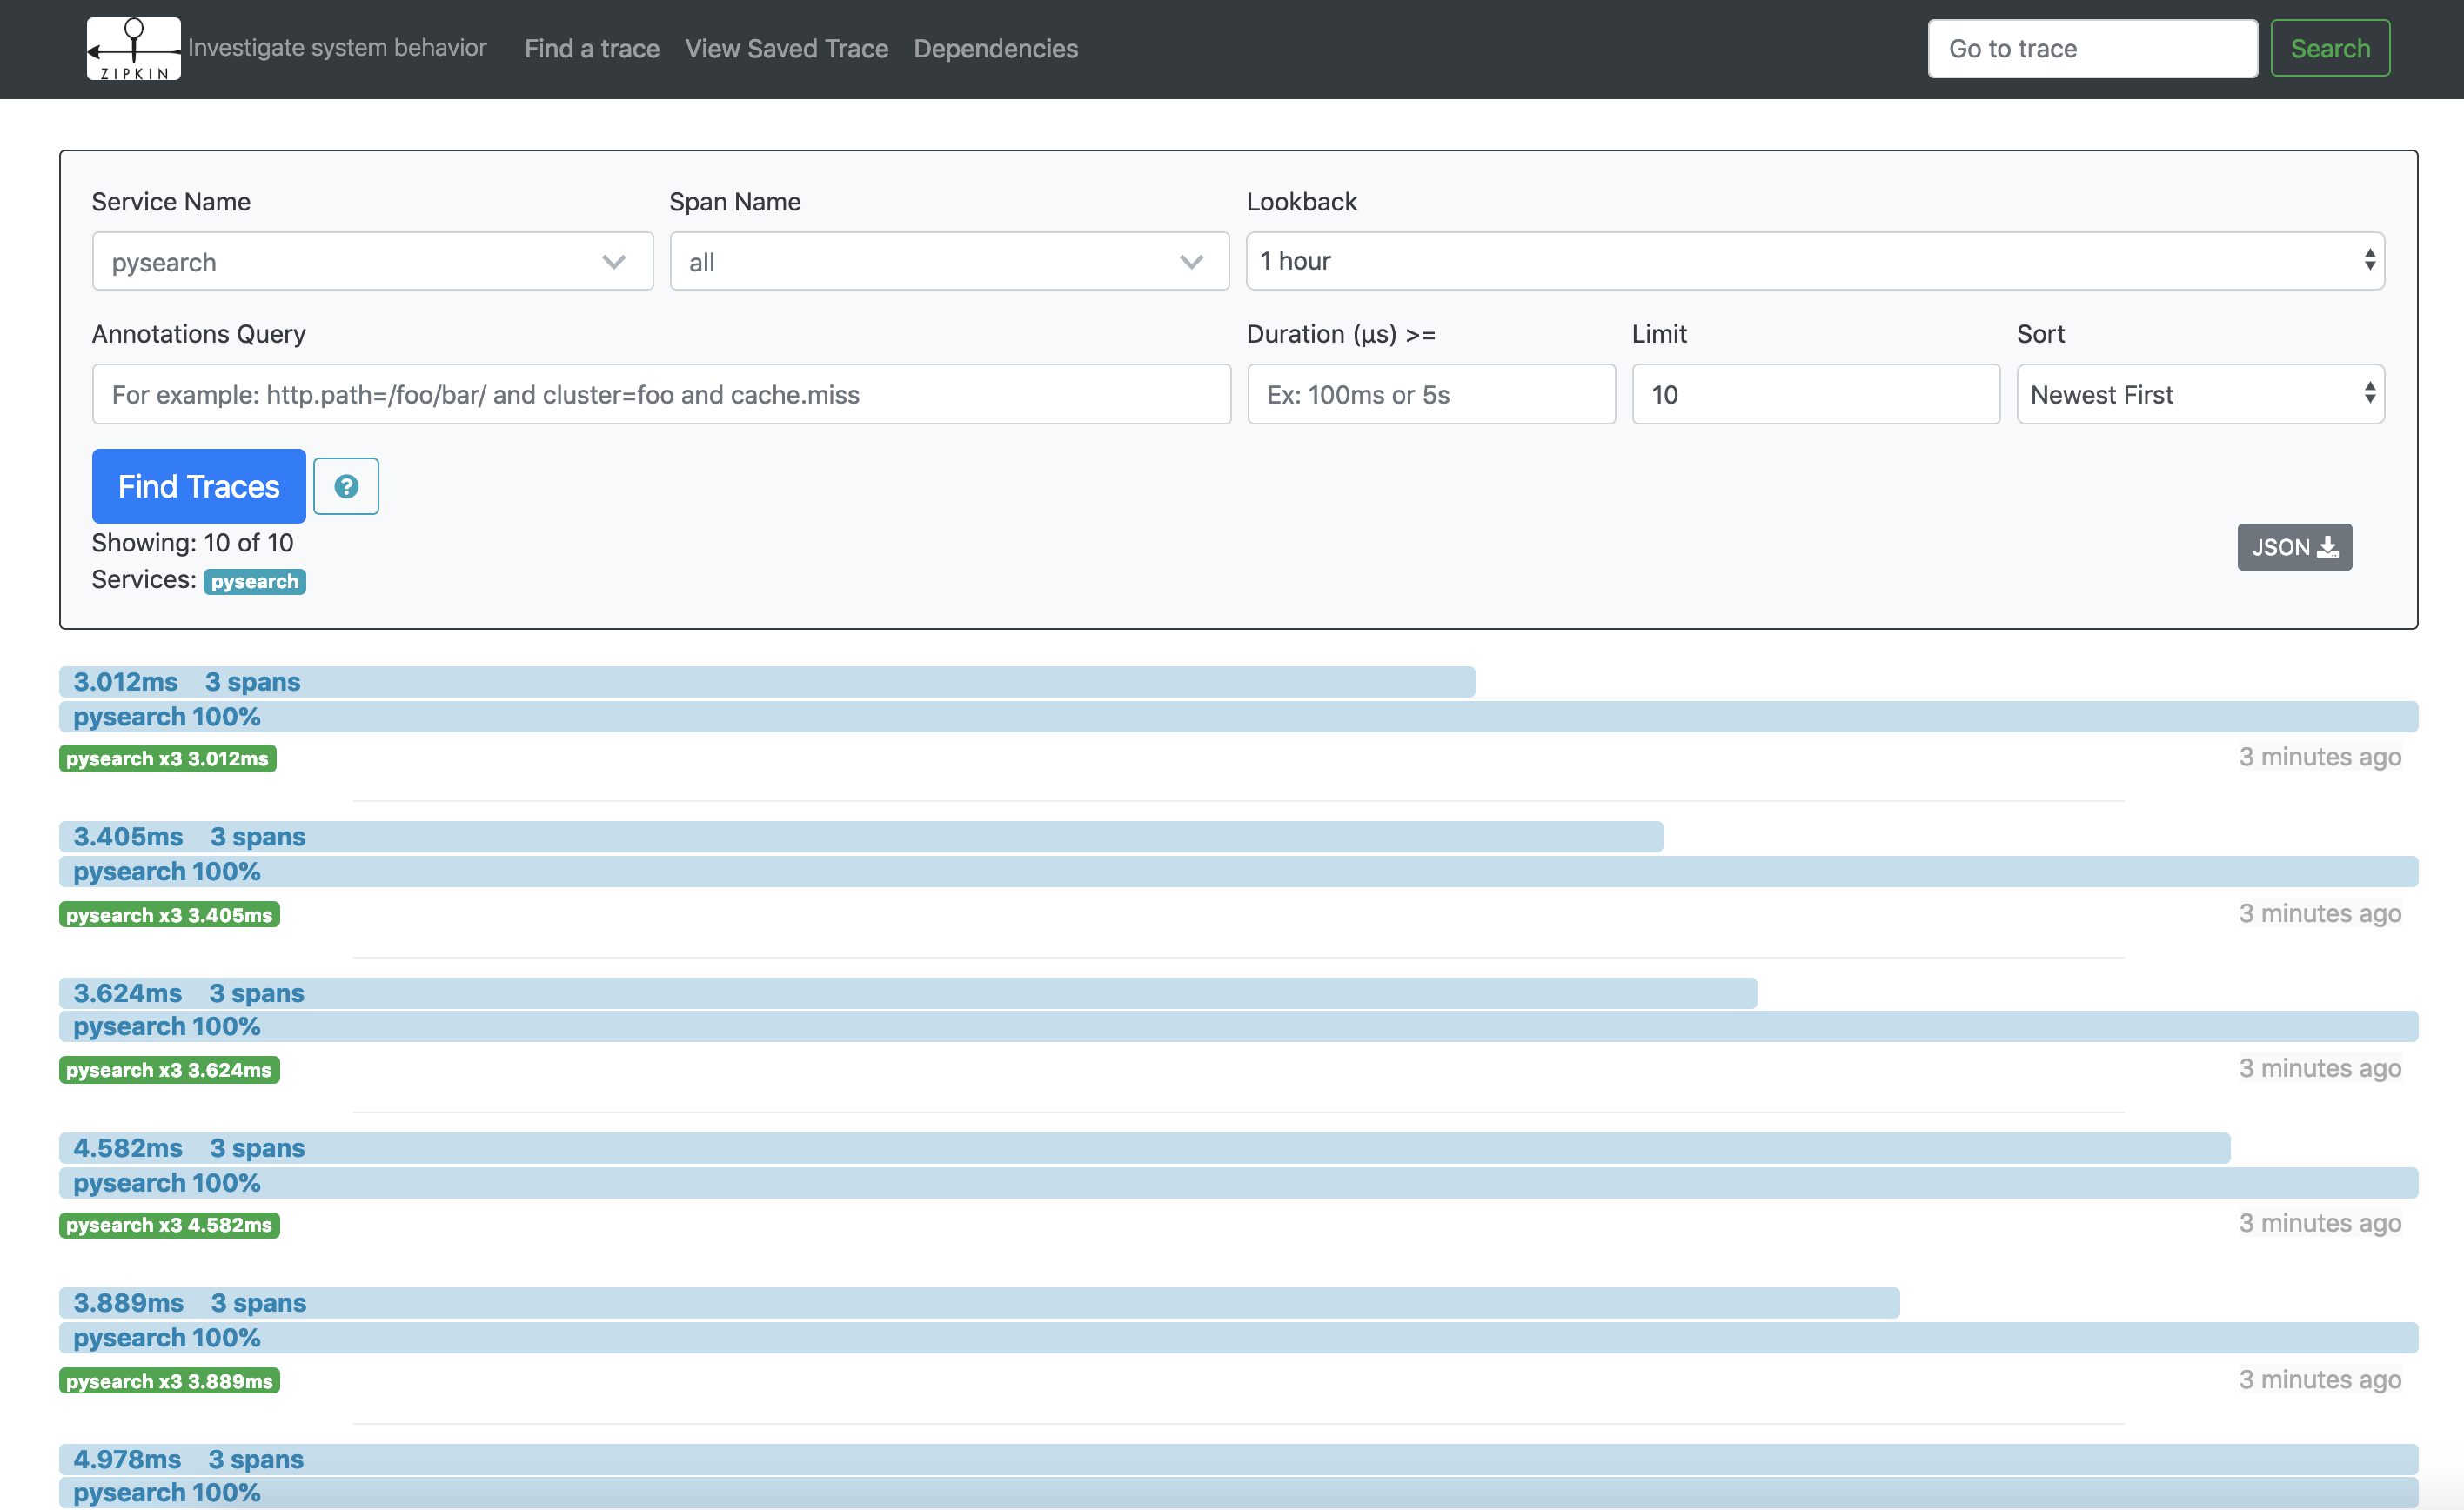
On navigating to the Zipkin UI at http://localhost:9411
All traces
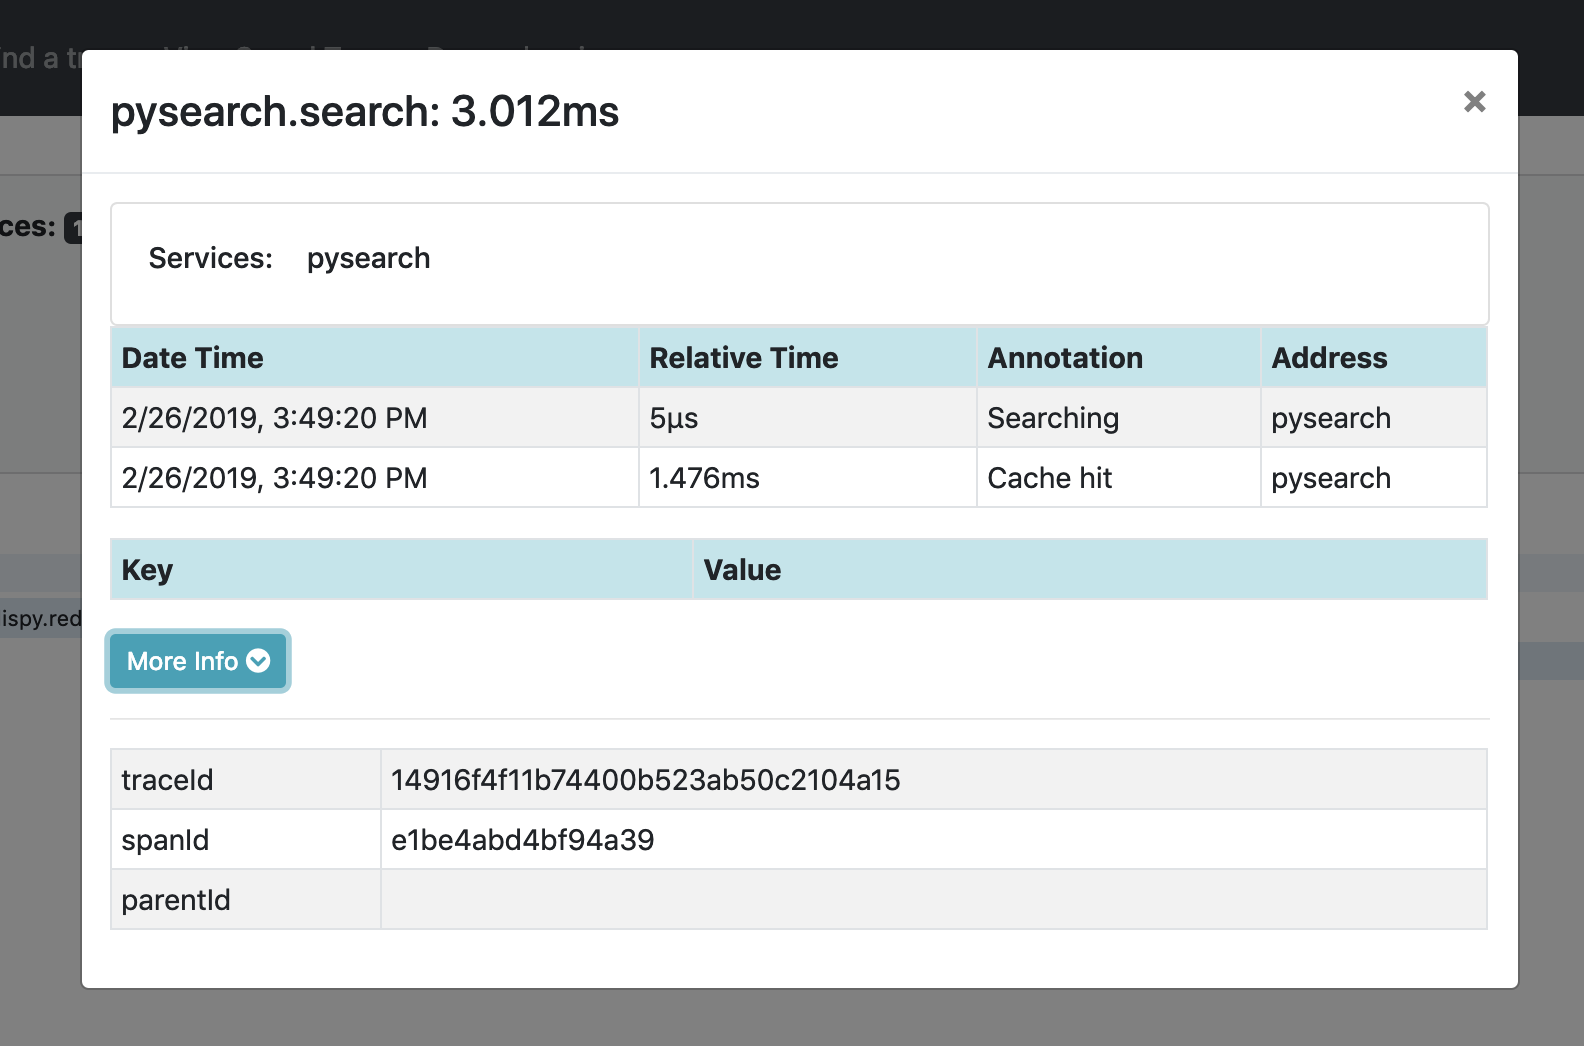
Cache hit

Cache hit detail
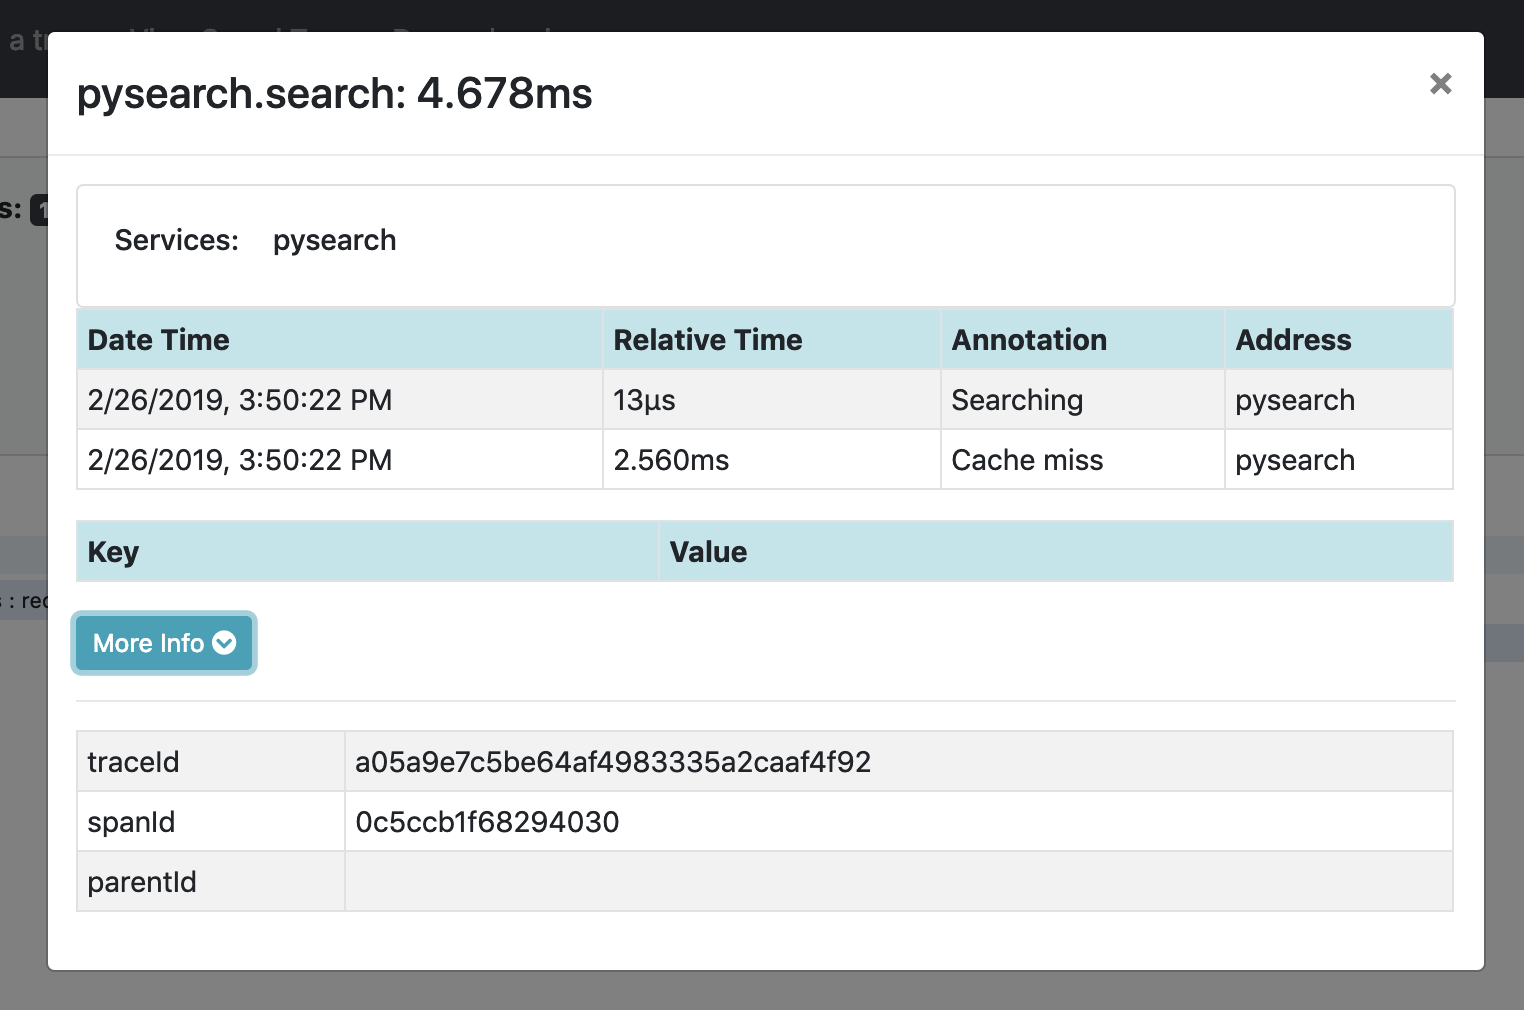
Cache miss

Cache miss detail
Examining metrics
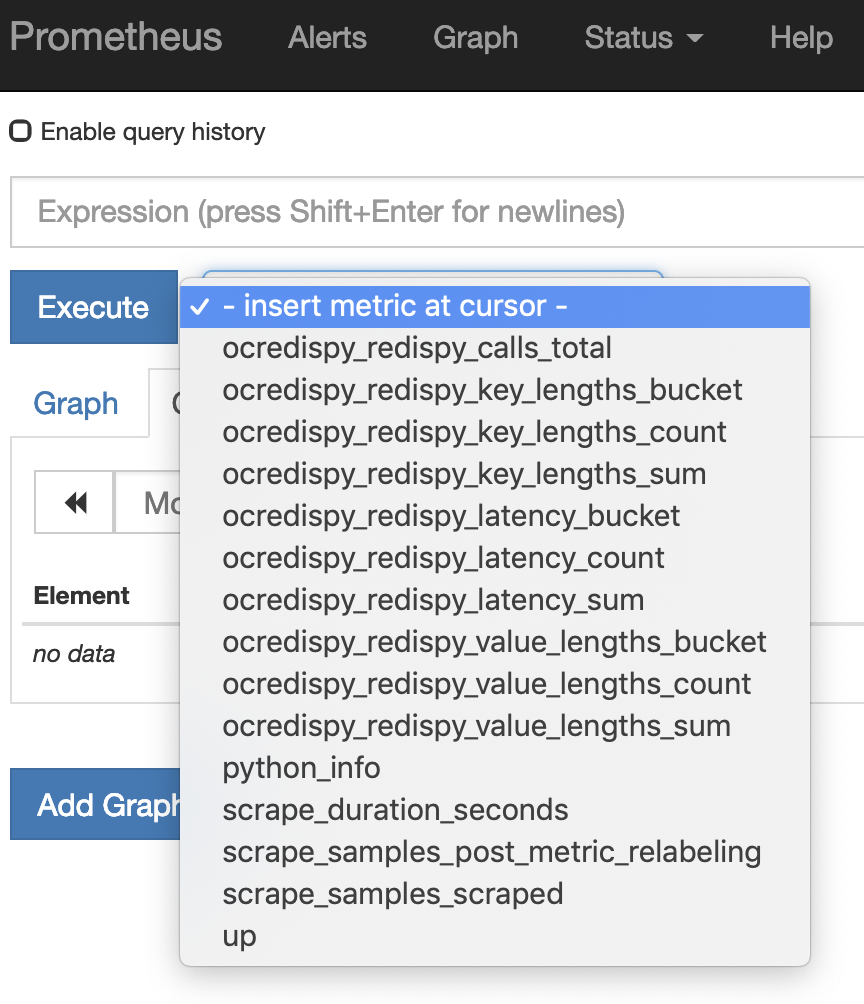
On navigating to the Prometheus UI at http://localhost:9090
All metrics
Rate of calls
rate(ocredispy_redispy_calls_total[5m])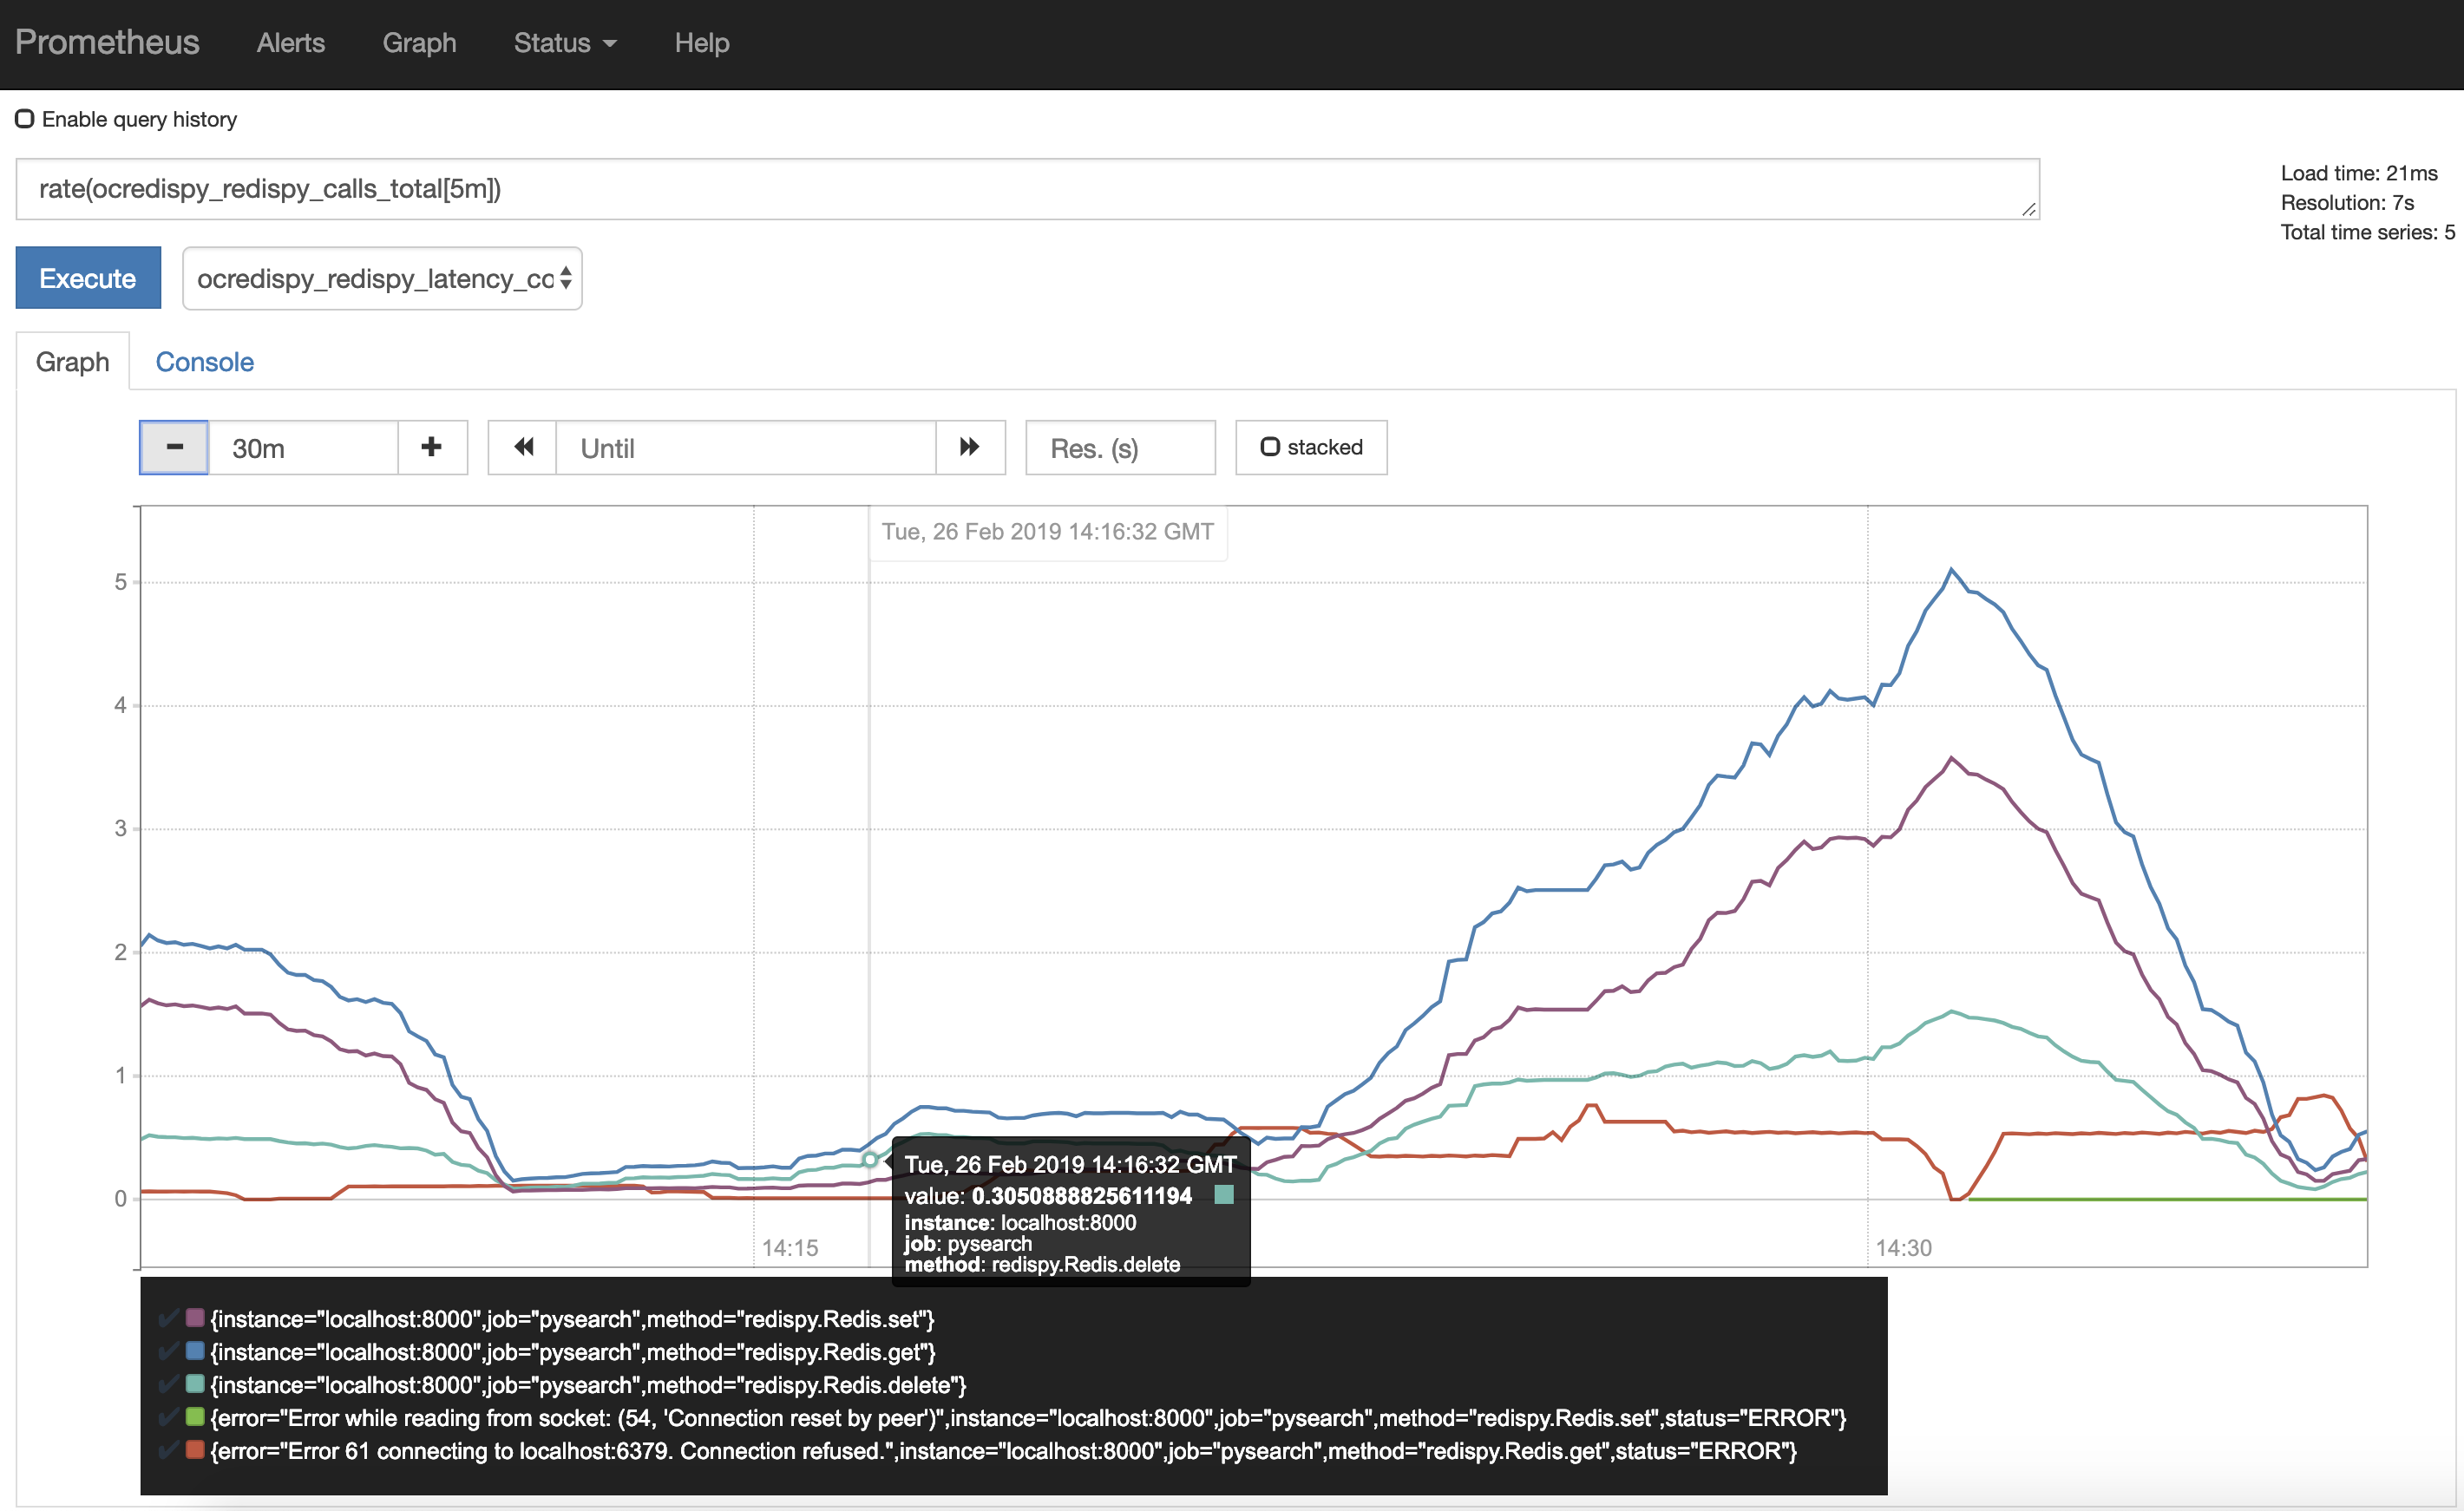
Latency p95th
histogram_quantile(0.95, sum(rate(ocredispy_redispy_latency_bucket[5m])) by (method, error, le))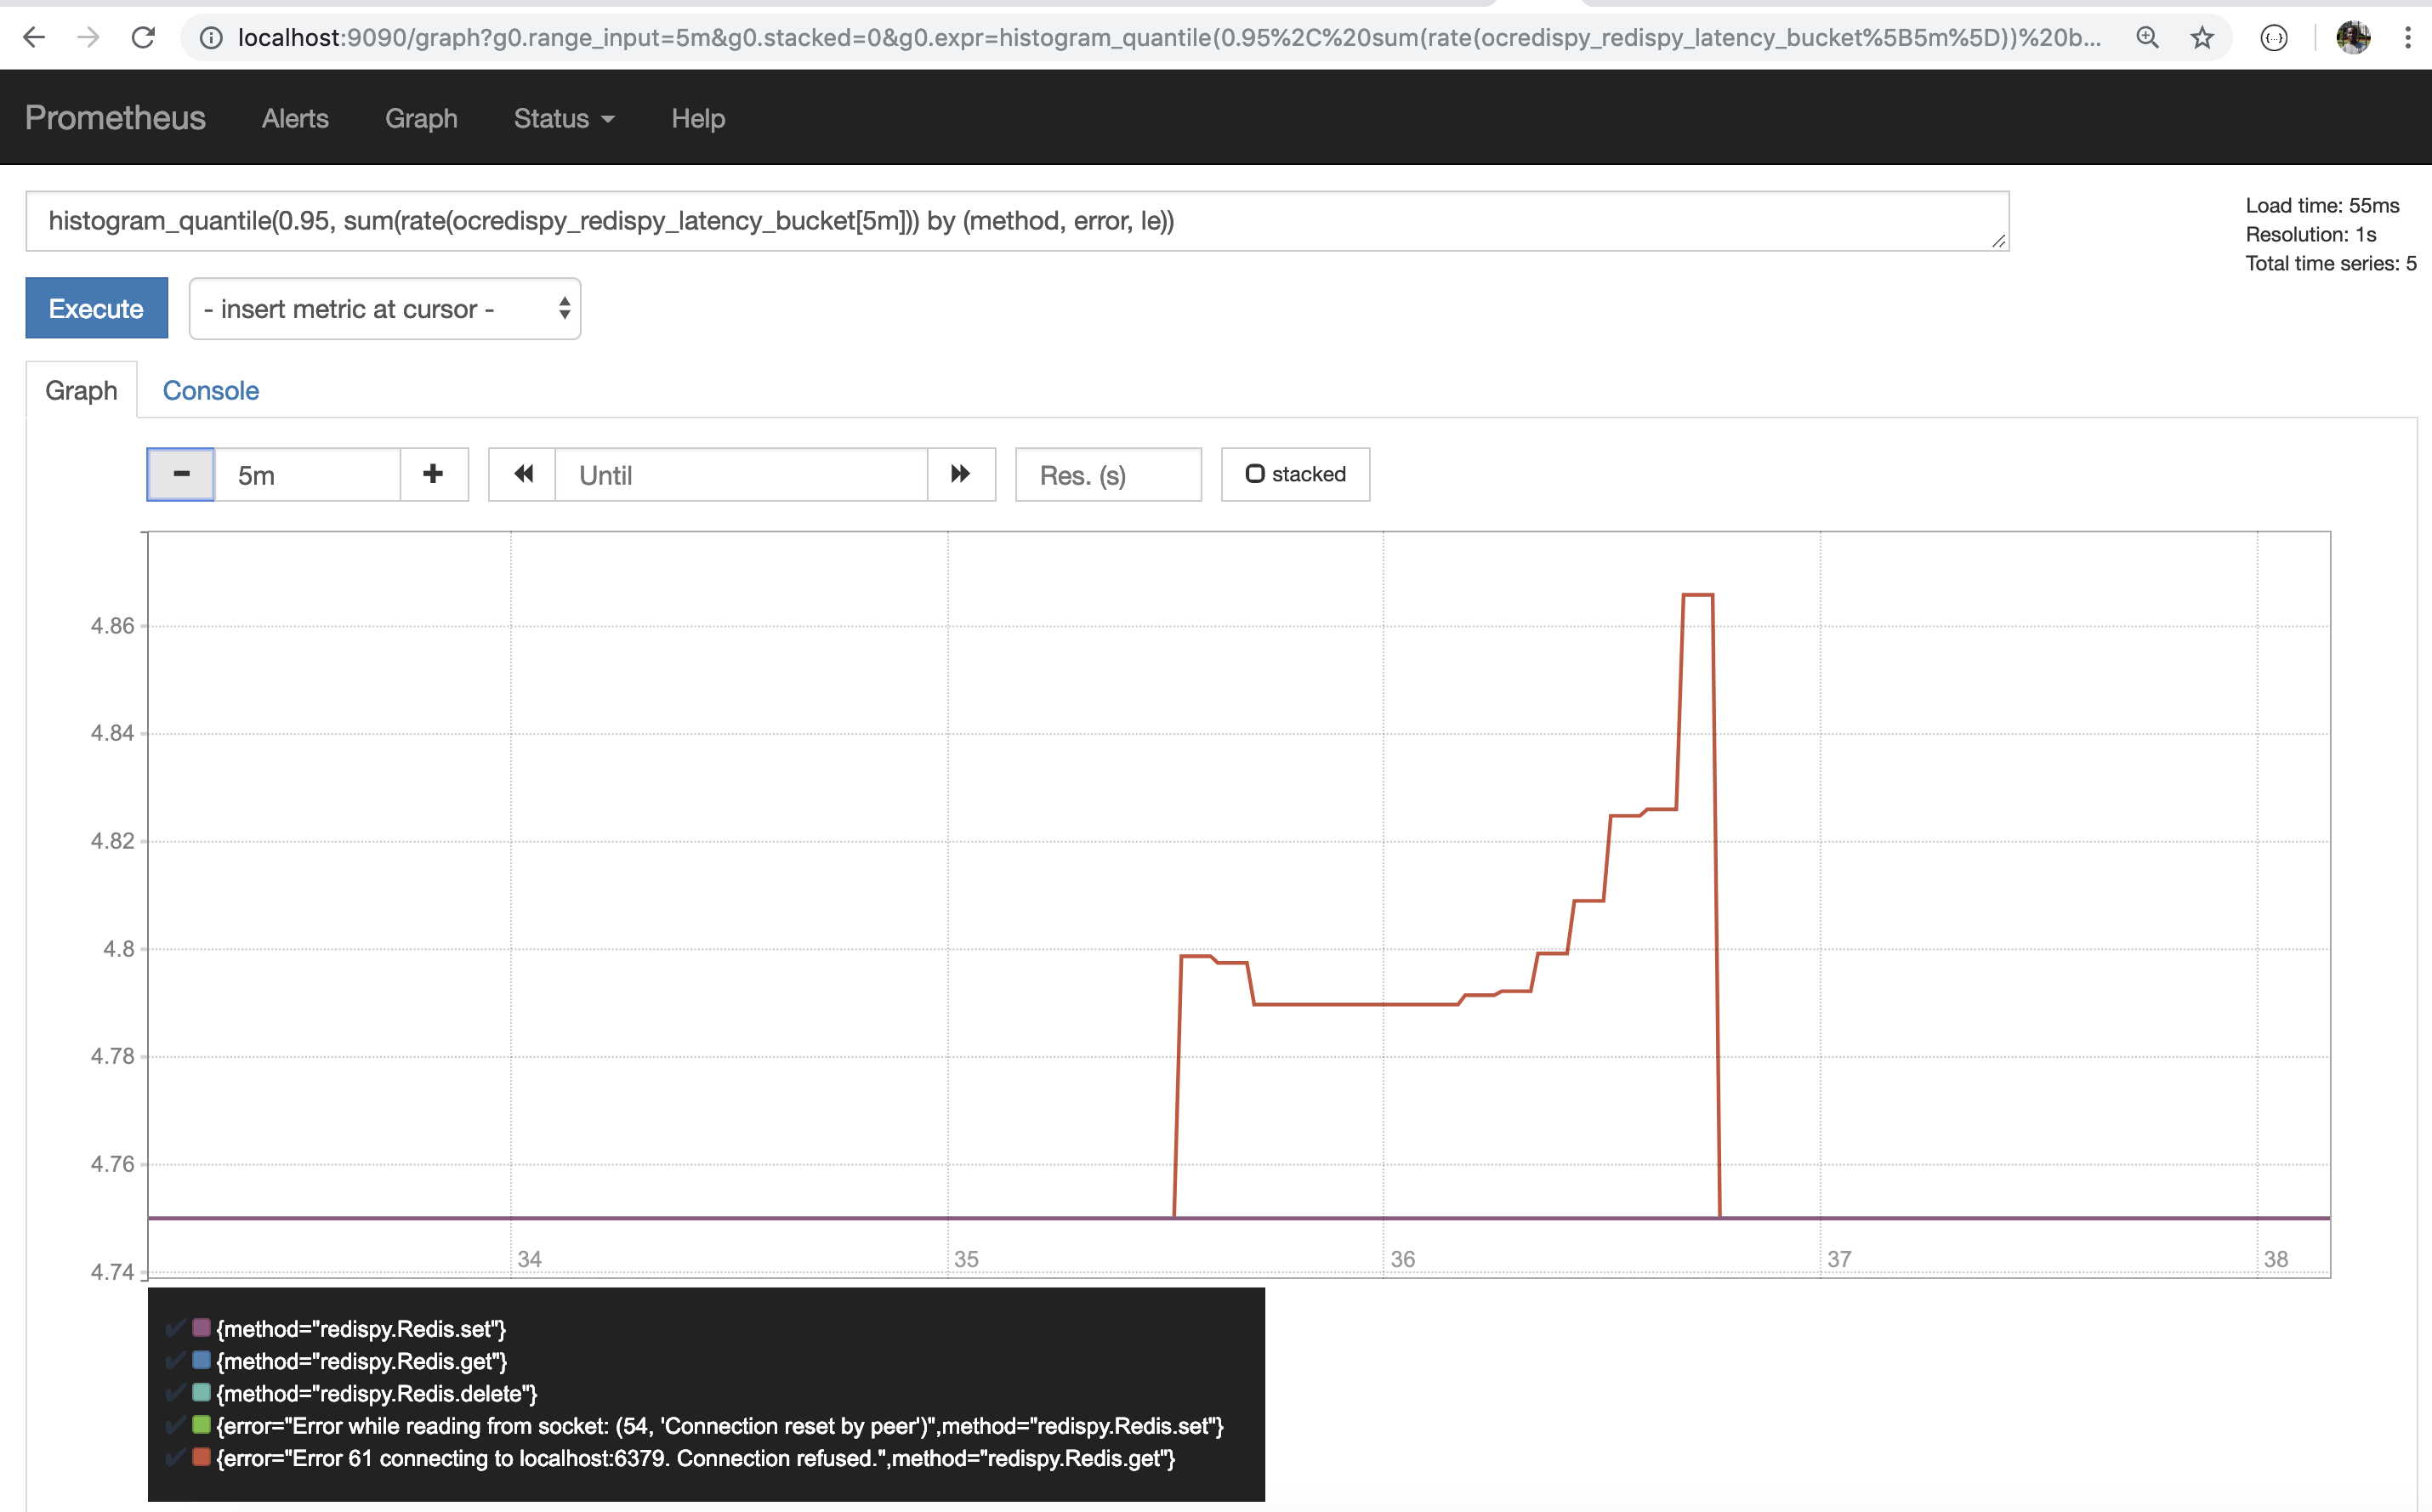
Key lengths p95th
histogram_quantile(0.95, sum(rate(ocredispy_redispy_key_lengths_bucket[5m])) by (method, error, le))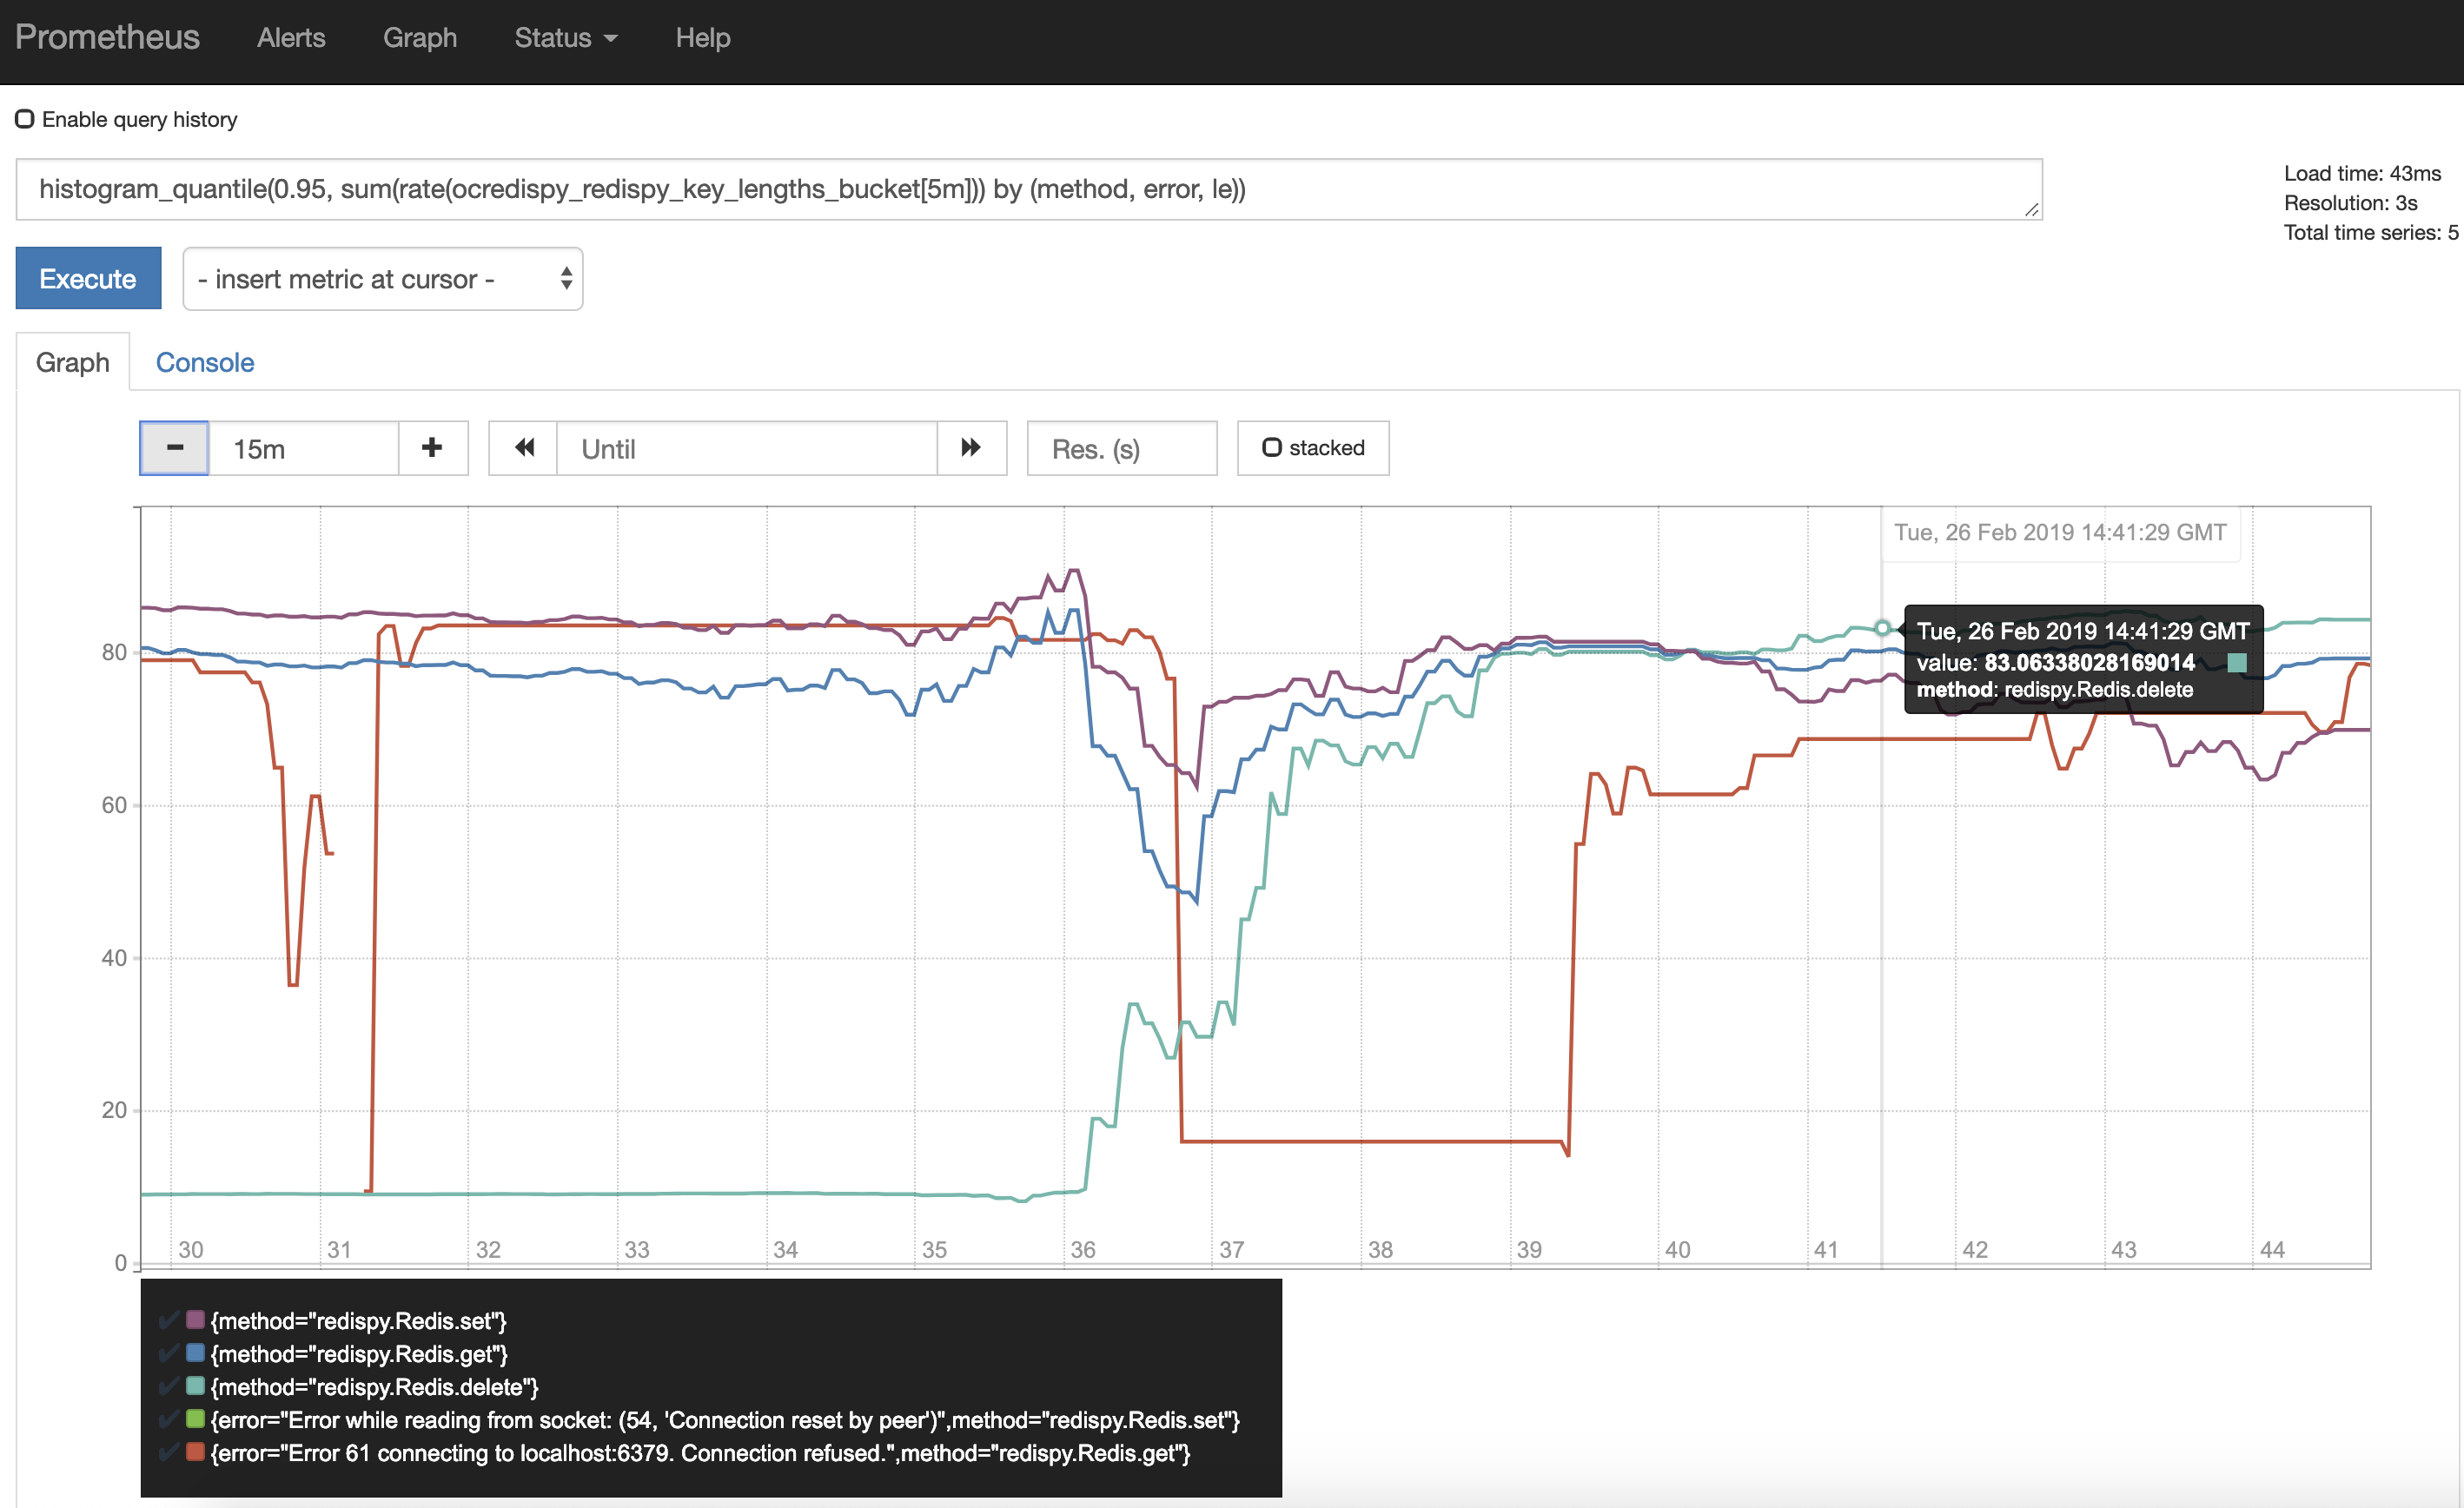
Value lengths p95th
histogram_quantile(0.95, sum(rate(ocredispy_redispy_value_lengths_bucket[5m])) by (method, error, le))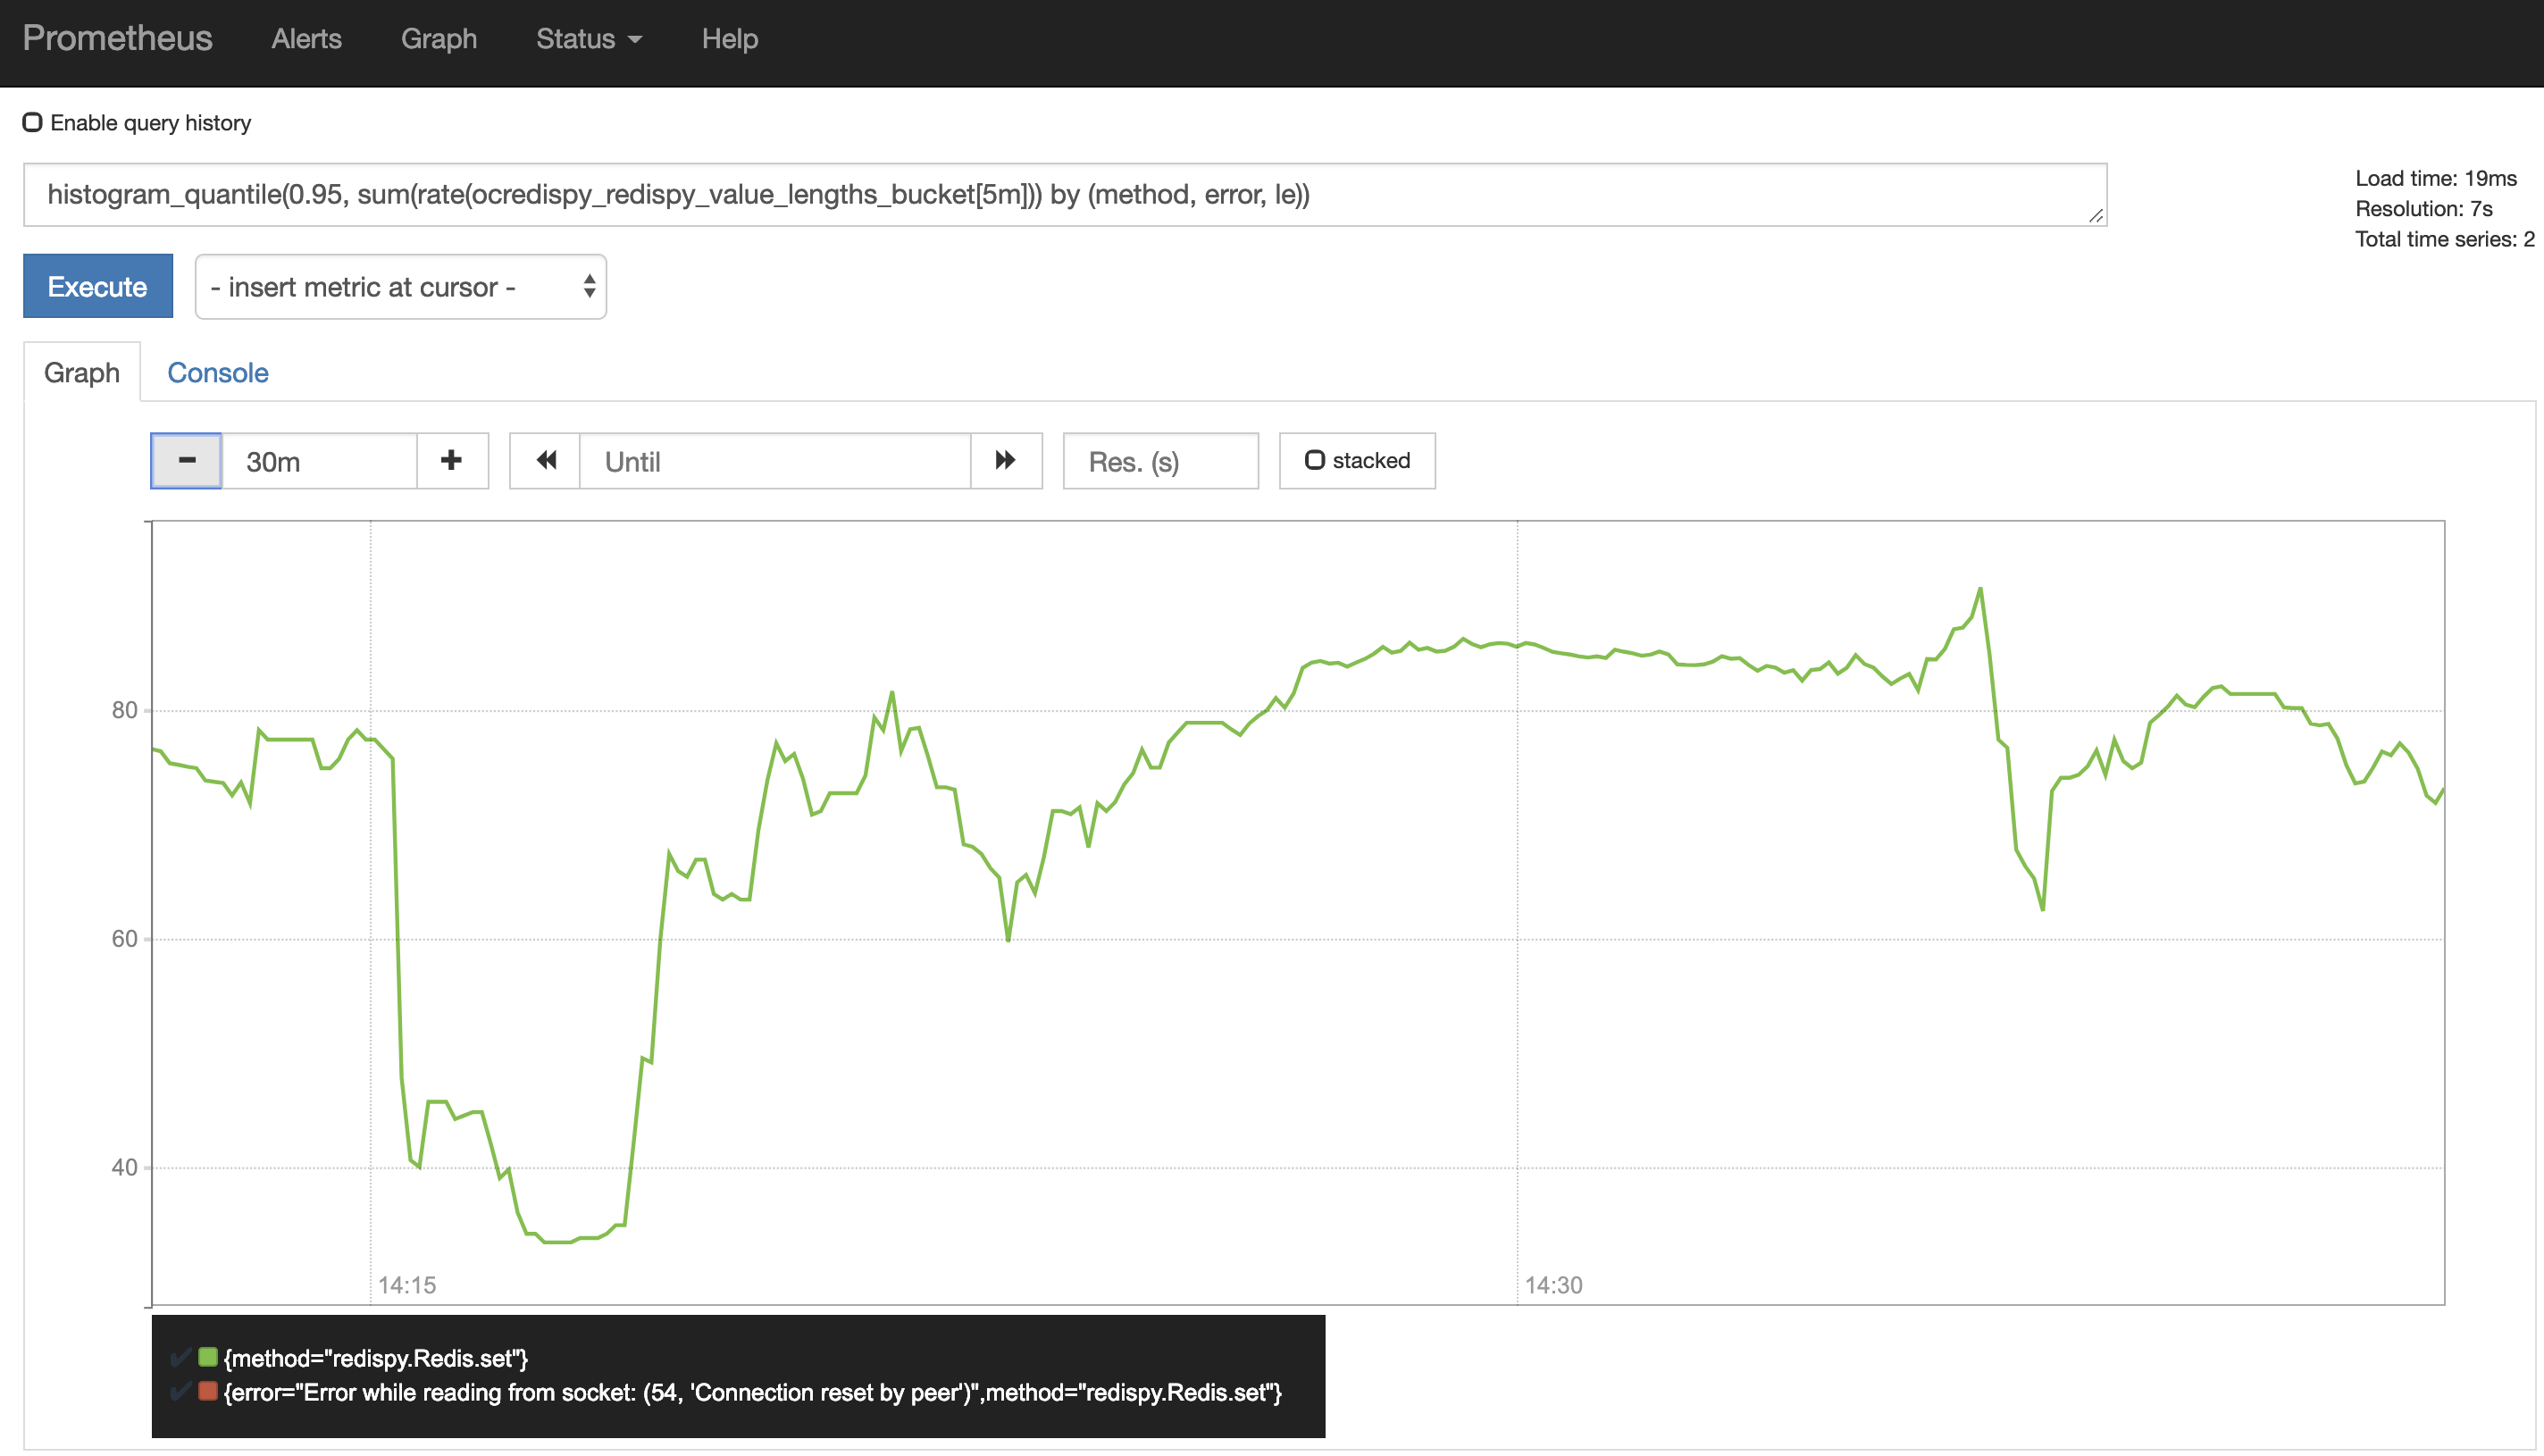
Notes
- To extract metrics, please don’t forget to invoke
ocredis.register_views()References
| Resource | URL |
|---|---|
| redis-py project home on Github | https://github.com/andymccurdy/redis-py |
| ocredispy on PyPi | https://pypi.org/project/ocredis/ |
| ocredispy on Github | https://github.com/opencensus-integrations/ocredispy |
