Metrics
- Requirements
- Brief Overview
- Getting started
- Enable metrics
- Instrumenting your functions
- Exporting to Prometheus
- End to end code
- Examining your metrics on Prometheus
- References
In this quickstart, we’ll glean insights from code segments and learn how to:
- Collect metrics using OpenCensus Metrics and Tags
- Register and enable an exporter for a backend of our choice
- View the metrics on the backend of our choice
Requirements
- A compiler: g++ or clang
- Bazel
- Prometheus
For assistance setting up Bazel Build, please click here.
Brief overview
By the end of this tutorial, we will do these four things to obtain metrics using OpenCensus:
- Create quantifiable metrics that we will record
- Create tags that we will associate with our metrics
- Organize our metrics, similar to writing a report, in to a
View - Export our views to a backend (Prometheus in this case)
Getting started
Our application is an interactive commandline application that:
- reads a line from standard input
- capitalizes the input
- prints out the capitalized data to standard output
In order to gain observability into the state of our application we shall collect the following metrics:
- Latency per processing loop
- Number of lines read
- Number of errors
- Line lengths
To get started, we’ll create a file metrics.cc
#include <iostream>

std::string capitalize(std::string in) {
    std::string out(in);
    for (auto it = out.begin(); it != out.end(); it++) {
        *it = std::toupper(*it);
    }
    return out;
}

int main() {
    while (1) {
        std::cout << "\n> ";
        std::string input;
        std::getline(std::cin, input);
        std::string res = capitalize(input);
        std::cout << "< " << res << std::endl;
    }
}
and to run it, we’ll use this command
g++ -std=c++11 metrics.cc -o metrics && ./metricswhich will produce output such as:
> bigger than this
< BIGGER THAN THIS

> this is the quickstart
< THIS IS THE QUICKSTART

> introductions
< INTRODUCTIONS

>
Enable metrics
To enable metrics, we’ll need to use the OpenCensus C++ library.
The library requires the Bazel build system.
Build system
For assistance setting up Bazel Build, please click here
Please install bazel first. After that, please proceed below.
To add metrics with OpenCensus, firstly we’ll need to use Bazel build to setup a couple of imports for:
After installing bazel, we’ll need to make two files in the same working directory as the metrics.cc
that is:
- WORKSPACE
- BUILD
WORKSPACE
Please add the content below to a file WORKSPACE:
load("@bazel_tools//tools/build_defs/repo:http.bzl", "http_archive")

http_archive(
    name = "io_opencensus_cpp",
    strip_prefix = "opencensus-cpp-master",
    urls = ["https://github.com/census-instrumentation/opencensus-cpp/archive/master.zip"],
)

# OpenCensus depends on Abseil so we have to explicitly to pull it in.
# This is how diamond dependencies are prevented.
http_archive(
    name = "com_google_absl",
    strip_prefix = "abseil-cpp-master",
    urls = ["https://github.com/abseil/abseil-cpp/archive/master.zip"]
)
http_archive tells bazel to configure an “external repository” by downloading an archive via http, unpacking it, and removing the top-level directory as per “strip_prefix”
BUILD
Please add the content below to a file BUILD:
cc_binary(
    name = "metrics",
    srcs = ["metrics.cc"],
    linkopts = ["-pthread"],
    deps = [
        "@com_google_absl//absl/time",
        "@io_opencensus_cpp//opencensus/stats:stats",
    ],
)depsis a list of libraries that our binary depends on. Alongside linking these libraries, bazel will also make their headers available to the compiler.@io_opencensus_cpprefers to an external subrepository//opencensus/statsis a directory path within that subdirectory:metricsis the name of a “cc_library” target in that directory
From the compiler’s point of view, all of the sources and dependencies’ headers are merged into a single hierarchy i.e.
metrics.cc
absl/...
opencensus/...
Measures
We’ll collect some metrics by using OpenCensus’ measures:
- Latency of every call
- Length of each line
- Number of lines
For each of the measurement that we make against each measure, we’ll tag them with the respective methods that processed them.
To enable that, we’ll create the measures:
#include "absl/strings/string_view.h"
#include "opencensus/stats/stats.h"

ABSL_CONST_INIT const absl::string_view kLatencyMeasureName     = "repl/latency";
ABSL_CONST_INIT const absl::string_view kLineLengthsMeasureName = "repl/line_lengths";

// Treat Measures and TagKeys as singletons and initialize on
// demand in order to avoid initialization order issues.

opencensus::stats::MeasureDouble LatencyMsMeasure() {
  static const auto measure = opencensus::stats::MeasureDouble::Register(
      kLatencyMeasureName, "The latency in milliseconds", "ms");
  return measure;
}

opencensus::stats::MeasureInt64 LineLengthsMeasure() {
  static const auto measure = opencensus::stats::MeasureInt64::Register(
      kLineLengthsMeasureName, "The distributions of line lengths", "By");
  return measure;
}
Tags
We’ll create a tag called “method”:
opencensus::tags::TagKey MethodKey() {
  static const auto key = opencensus::tags::TagKey::Register("method");
  return key;
}
Views
To aggregate recorded measurements with tags against measures, we’ll need to make a couple of views:
- Latency of every call: each call will be tagged with “method” and contain a distribution of the various latencies in milliseconds.
- Length of each line: each call will be tagged with “method” and contain a distribution of the various line lengths in bytes.
- Number of lines: just a count aggregation of the
m_line_lengthsmeasure.
and for that, the code will look like this:
void RegisterViews() {
  // 1. Latency view
  // We need to register the measure before registering the view.
  LatencyMsMeasure();
  opencensus::stats::ViewDescriptor()
      .set_name("ocquickstart.io/latency")
      .set_description("The various methods' latencies in milliseconds")
      .set_measure(kLatencyMeasureName)
      .set_aggregation(opencensus::stats::Aggregation::Distribution(
          opencensus::stats::BucketBoundaries::Explicit(
              {0, 25, 50, 75, 100, 200, 400, 600, 800, 1000, 2000, 4000,
               6000})))
      .add_column(MethodKey())
      .RegisterForExport();

  // 2. Line lengths
  LineLengthsMeasure();
  opencensus::stats::ViewDescriptor()
      .set_name("ocquickstart.io/line_lengths")
      .set_description("The length of the lines read in")
      .set_measure(kLineLengthsMeasureName)
      .set_aggregation(opencensus::stats::Aggregation::Distribution(
          opencensus::stats::BucketBoundaries::Explicit(
              {0, 5, 10, 15, 20, 40, 60, 80, 100, 200, 400, 600, 800,
               1000})))
      .add_column(MethodKey())
      .RegisterForExport();

  // 3. Lines count: just a count aggregation on the line lengths measure
  opencensus::stats::ViewDescriptor()
      .set_name("ocquickstart.io/lines_in")
      .set_description("The number of lines read in")
      .set_measure(kLineLengthsMeasureName)
      .set_aggregation(opencensus::stats::Aggregation::Count())
      .add_column(MethodKey())
      .RegisterForExport();
}

int main(int argc, char **argv) {
  // Register the views to enable stats aggregation
  RegisterViews();

  // ...
}
Instrumenting your functions
To capture latencies, number of lines and line lengths, we’ll need to run the following steps:
Start timer
On entry into any function, we’ll start a timer:
absl::Time start = absl::Now();End timer
On completion of the capitalization, we end the timer and retrieve the latency in milliseconds:
    absl::Time end = absl::Now();
    double latency_ms = absl::ToDoubleMilliseconds(end - start);
Record latencies against tags
Record latencies against the respective measures and tagKey “method”:
  opencensus::stats::Record({{LatencyMsMeasure(), latency_ms},
                             {LineLengthsMeasure(), input.length()}},
                            {{MethodKey(), "getLine"}});
which collectively then makes our helper functions getLine and processLine look like this:
std::string getLine() {
  absl::Time start = absl::Now();

  std::string input;

  // Get the line
  std::getline(std::cin, input);

  absl::Time end = absl::Now();
  double latency_ms = absl::ToDoubleMilliseconds(end - start);

  // Record both measures at once.
  opencensus::stats::Record({{LatencyMsMeasure(), latency_ms},
                             {LineLengthsMeasure(), input.length()}},
                            {{MethodKey(), "getLine"}});
  return input;
}

std::string processLine(const std::string& in) {
  absl::Time start = absl::Now();
  std::string out(in);

  for (auto it = out.begin(); it != out.end(); it++) {
    *it = std::toupper(*it);
  }

  absl::Time end = absl::Now();
  double latency_ms = absl::ToDoubleMilliseconds(end - start);

  opencensus::stats::Record({{LatencyMsMeasure(), latency_ms}},
                            {{MethodKey(), "processLine"}});
  return out;
}
Exporting to Prometheus
To examine our metrics, we’ll use Prometheus.
For assistance setting up Prometheus, click here for a guided codelab.
To use the Prometheus exporter for OpenCensus C++, we’ll need to update our BUILD, WORKSPACE and metrics.cc files
as below:
BUILD
cc_binary(
    name = "metrics",
    srcs = ["metrics.cc"],
    linkopts = ["-pthread"],
    deps = [
        "@com_github_jupp0r_prometheus_cpp//pull",
        "@com_google_absl//absl/base:core_headers",
        "@com_google_absl//absl/memory",
        "@com_google_absl//absl/strings",
        "@io_opencensus_cpp//opencensus/exporters/stats/prometheus:prometheus_exporter",
        "@io_opencensus_cpp//opencensus/stats",
        "@io_opencensus_cpp//opencensus/tags",
    ],
)
WORKSPACE
load("@bazel_tools//tools/build_defs/repo:http.bzl", "http_archive")

http_archive(
    name = "io_opencensus_cpp",
    strip_prefix = "opencensus-cpp-master",
    urls = ["https://github.com/census-instrumentation/opencensus-cpp/archive/master.zip"],
)

# OpenCensus depends on Abseil so we have to explicitly to pull it in.
# This is how diamond dependencies are prevented.
http_archive(
    name = "com_google_absl",
    strip_prefix = "abseil-cpp-master",
    urls = ["https://github.com/abseil/abseil-cpp/archive/master.zip"]
)

# OpenCensus depends on jupp0r/prometheus-cpp
http_archive(
    name = "com_github_jupp0r_prometheus_cpp",
    strip_prefix = "prometheus-cpp-master",
    urls = ["https://github.com/jupp0r/prometheus-cpp/archive/master.zip"],
)

load("@com_github_jupp0r_prometheus_cpp//bazel:repositories.bzl", "prometheus_cpp_repositories")

prometheus_cpp_repositories()
Prometheus exporter source code
#include "opencensus/exporters/stats/prometheus/prometheus_exporter.h"
#include "prometheus/exposer.h"

int main(int argc, char **argv) {
    auto exporter =
        std::make_shared<opencensus::exporters::stats::PrometheusExporter>();
    // Expose Prometheus on :8888
    prometheus::Exposer exposer("127.0.0.1:8888");
    exposer.RegisterCollectable(exporter);

    // ...
}
End to end code
Our final code should now look like this
#include <iostream>

#include "absl/strings/string_view.h"
#include "absl/time/clock.h"
#include "opencensus/exporters/stats/prometheus/prometheus_exporter.h"
#include "opencensus/stats/stats.h"
#include "opencensus/tags/tag_key.h"
#include "prometheus/exposer.h"

namespace {

ABSL_CONST_INIT const absl::string_view kLatencyMeasureName = "repl/latency";
ABSL_CONST_INIT const absl::string_view kLineLengthsMeasureName =
    "repl/line_lengths";

// Treat Measures and TagKeys as singletons and initialize on
// demand in order to avoid initialization order issues.

opencensus::stats::MeasureDouble LatencyMsMeasure() {
  static const auto measure = opencensus::stats::MeasureDouble::Register(
      kLatencyMeasureName, "The latency in milliseconds", "ms");
  return measure;
}

opencensus::stats::MeasureInt64 LineLengthsMeasure() {
  static const auto measure = opencensus::stats::MeasureInt64::Register(
      kLineLengthsMeasureName, "The distributions of line lengths", "By");
  return measure;
}

opencensus::tags::TagKey MethodKey() {
  static const auto key = opencensus::tags::TagKey::Register("method");
  return key;
}

void RegisterViews() {
  // 1. Latency view
  // We need to register the measure before registering the view.
  LatencyMsMeasure();
  opencensus::stats::ViewDescriptor()
      .set_name("ocquickstart.io/latency")
      .set_description("The various methods' latencies in milliseconds")
      .set_measure(kLatencyMeasureName)
      .set_aggregation(opencensus::stats::Aggregation::Distribution(
          opencensus::stats::BucketBoundaries::Explicit(
              {0, 25, 50, 75, 100, 200, 400, 600, 800, 1000, 2000, 4000,
               6000})))
      .add_column(MethodKey())
      .RegisterForExport();

  // 2. Line lengths
  LineLengthsMeasure();
  opencensus::stats::ViewDescriptor()
      .set_name("ocquickstart.io/line_lengths")
      .set_description("The length of the lines read in")
      .set_measure(kLineLengthsMeasureName)
      .set_aggregation(opencensus::stats::Aggregation::Distribution(
          opencensus::stats::BucketBoundaries::Explicit(
              {0, 5, 10, 15, 20, 40, 60, 80, 100, 200, 400, 600, 800,
               1000})))
      .add_column(MethodKey())
      .RegisterForExport();

  // 3. Lines count: just a count aggregation on the line lengths measure
  opencensus::stats::ViewDescriptor()
      .set_name("ocquickstart.io/lines_in")
      .set_description("The number of lines read in")
      .set_measure(kLineLengthsMeasureName)
      .set_aggregation(opencensus::stats::Aggregation::Count())
      .add_column(MethodKey())
      .RegisterForExport();
}

std::string getLine() {
  absl::Time start = absl::Now();

  std::string input;

  // Get the line
  std::getline(std::cin, input);

  absl::Time end = absl::Now();
  double latency_ms = absl::ToDoubleMilliseconds(end - start);

  // Record both measures at once.
  opencensus::stats::Record({{LatencyMsMeasure(), latency_ms},
                             {LineLengthsMeasure(), input.length()}},
                            {{MethodKey(), "getLine"}});
  return input;
}

std::string processLine(const std::string& in) {
  absl::Time start = absl::Now();
  std::string out(in);

  for (auto it = out.begin(); it != out.end(); it++) {
    *it = std::toupper(*it);
  }

  absl::Time end = absl::Now();
  double latency_ms = absl::ToDoubleMilliseconds(end - start);

  opencensus::stats::Record({{LatencyMsMeasure(), latency_ms}},
                            {{MethodKey(), "processLine"}});
  return out;
}

}  // namespace

int main(int argc, char** argv) {
  // Firstly enable the Prometheus exporter
  auto exporter =
      std::make_shared<opencensus::exporters::stats::PrometheusExporter>();
  // Expose Prometheus on :8888
  prometheus::Exposer exposer("127.0.0.1:8888");
  exposer.RegisterCollectable(exporter);

  // Register the views to enable stats aggregation
  RegisterViews();

  while (1) {
    std::cout << "\n> ";
    std::string input = getLine();
    std::string upper = processLine(input);
    std::cout << "< " << upper << std::endl;
  }
}
which will expose a Prometheus scrape endpoint at localhost:8888.
Before we run it, we’ll need to setup our Prometheus configuration file config.yaml
scrape_configs:
  - job_name: 'ocquickstartcpp'

    scrape_interval: 10s

    static_configs:
      - targets: ['localhost:8888']
Running Prometheus in a separate terminal but in the same working directory as config.yaml
prometheus --config.file=config.yamlAnd finally building and running our code with bazel
bazel build :metrics && ./bazel-bin/metricsand after interacting with the terminal by typing in content and hitting enter
$ ./bazel-bin/metrics
*** 1540010354.263193000 1540010354263193000 140736248275840 mg_start:14260: [listening_ports] -> [127.0.0.1:8888]
*** 1540010354.263233000        40000 140736248275840 mg_start:14260: [num_threads] -> [2]
*** 1540010354.263405000       172000 123145448206336 consume_socket:13508: going idle
*** 1540010354.263431000        26000 123145448742912 consume_socket:13508: going idle

> this is one
< THIS IS ONE

*** 1540010356.902653000   2639222000 123145447669760 accept_new_connection:13770: Accepted socket 4
*** 1540010356.902697000        44000 123145447669760 produce_socket:13558: queued socket 4
*** 1540010356.902761000        64000 123145448206336 consume_socket:13521: grabbed socket 4, going busy
*** 1540010356.902807000        46000 123145448206336 worker_thread_run:13657: Start processing connection from 127.0.0.1
*** 1540010356.902814000         7000 123145448206336 process_new_connection:13325: calling getreq (1 times for this connection)
*** 1540010356.902889000        75000 123145448206336 process_new_connection:13386: http: 1.1, error: none
*** 1540010356.902905000        16000 123145448206336 handle_request:10653: URL: /metrics
*** 1540010356.902968000        63000 123145448206336 open_auth_file:6082: fopen(/.htpasswd): No such file or directory
*** 1540010356.903336000       368000 123145448206336 process_new_connection:13392: handle_request done
*** 1540010356.903354000        18000 123145448206336 worker_thread_run:13702: Done processing connection from 127.0.0.1 (0.000000 sec)
*** 1540010356.903410000        56000 123145448206336 worker_thread_run:13706: Connection closed
*** 1540010356.903416000         6000 123145448206336 consume_socket:13508: going idle
> that is another
< THAT IS ANOTHER

> true true
< TRUE TRUE

> say what?
< SAY WHAT?
Examining your metrics on Prometheus
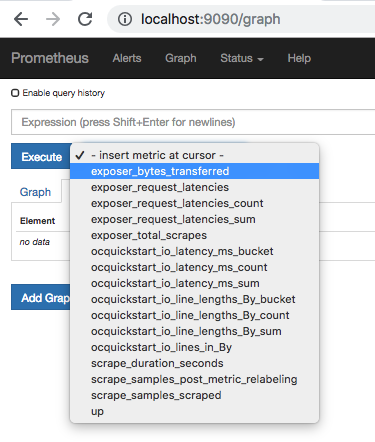
By navigating to the Prometheus UI at http://localhost:9090
You can also see the raw metrics at http://localhost:8888/metrics
Available metrics

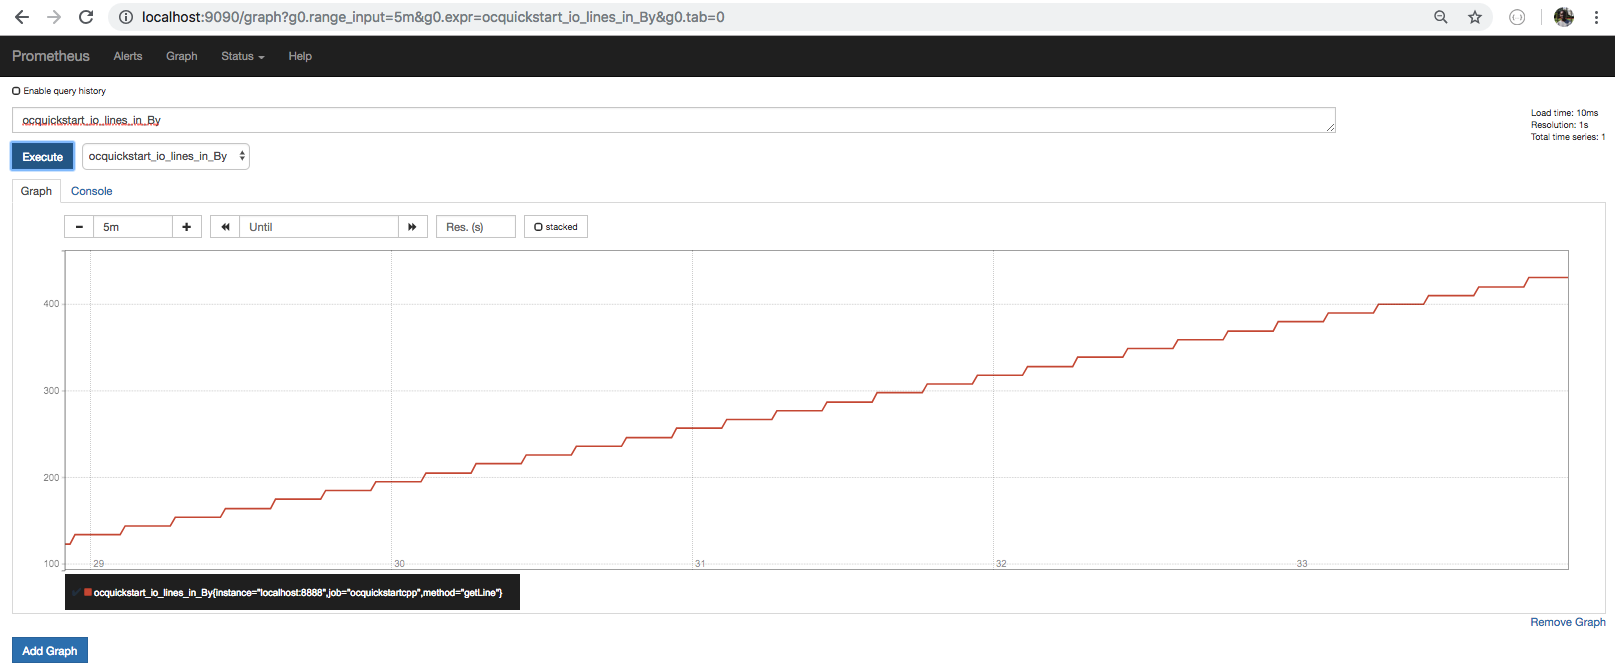
Lines in counts

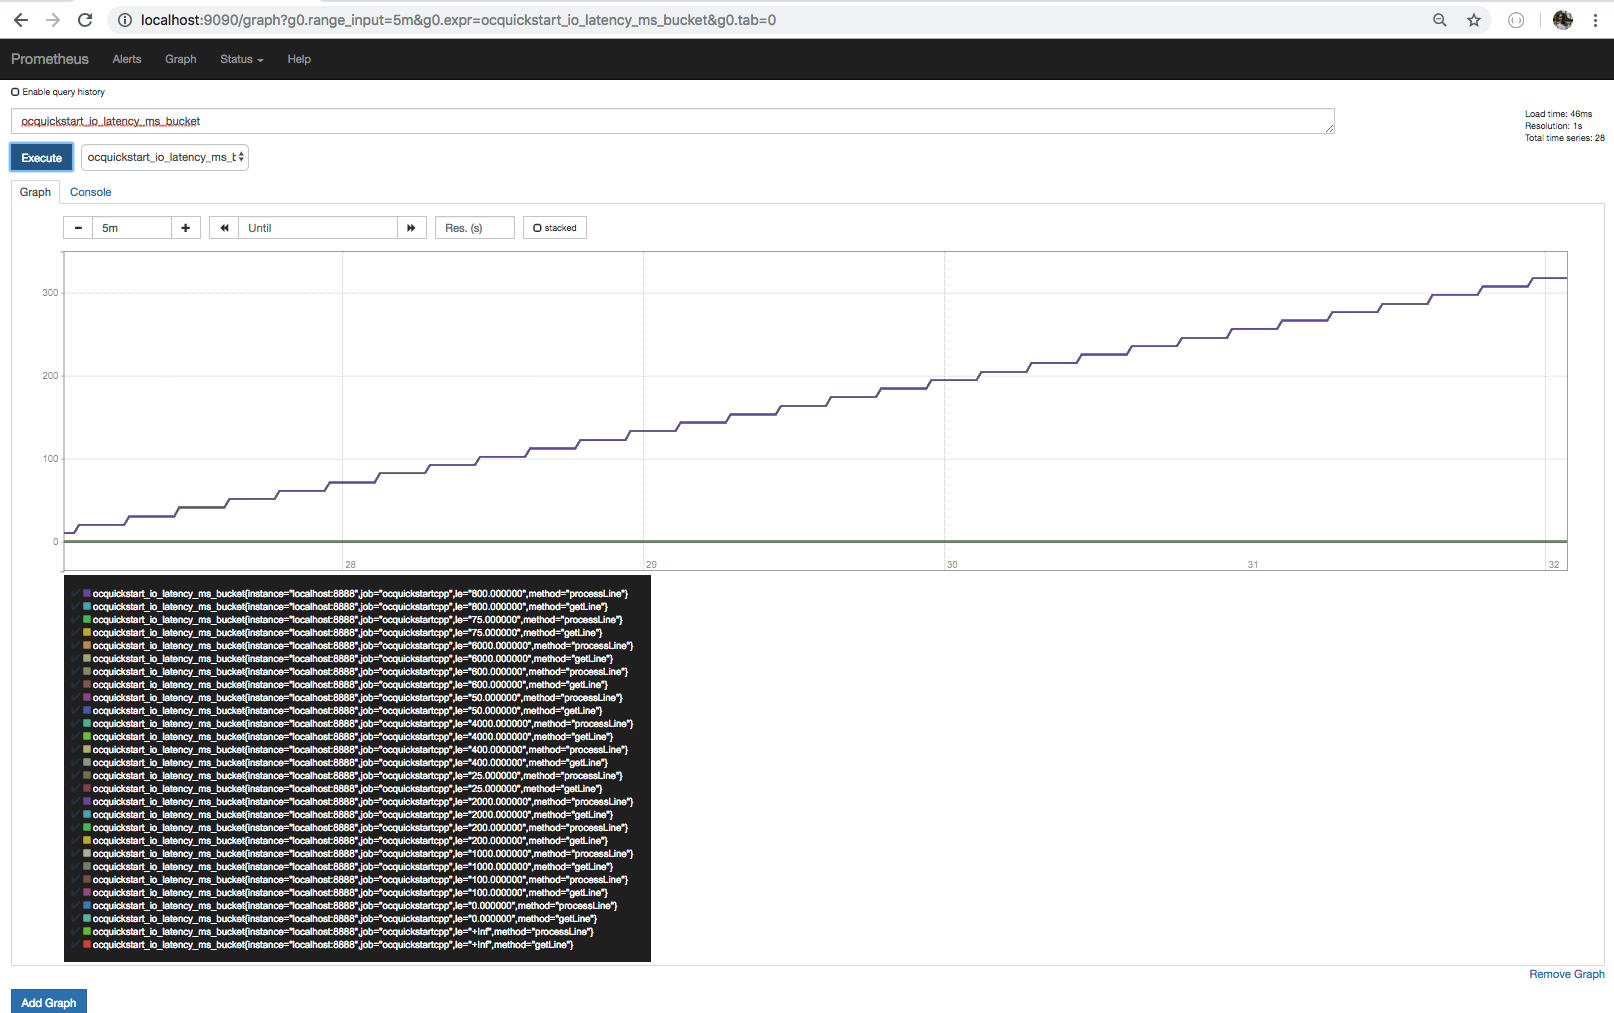
Latency distributions

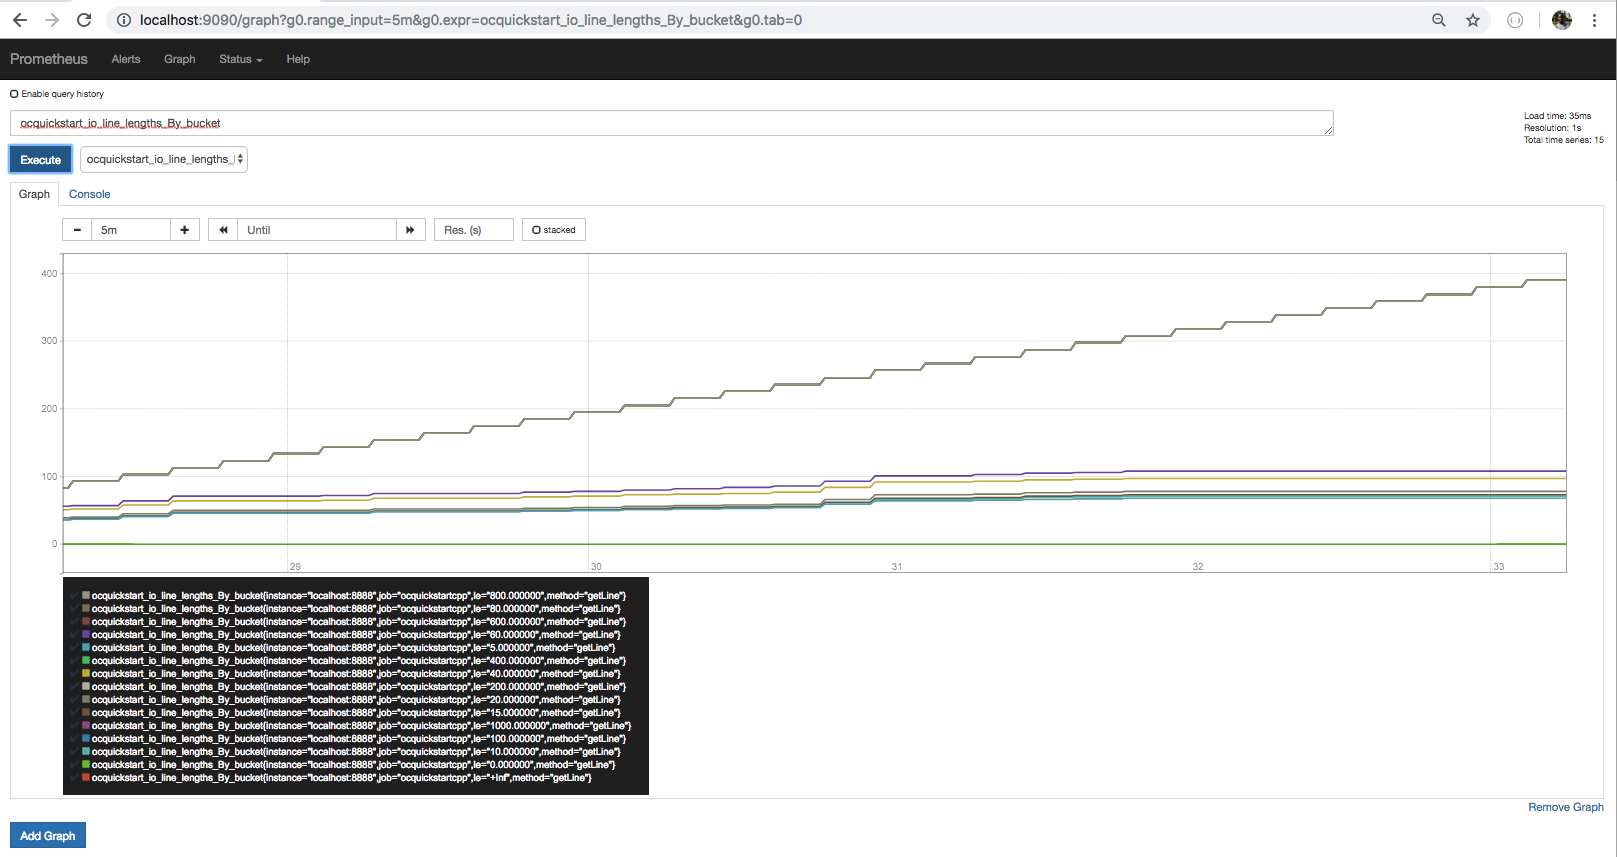
Line lengths distributions

References
| Resource | URL |
|---|---|
| OpenCensus C++ | https://github.com/census-instrumentation/opencensus-cpp |
| Prometheus project | https://prometheus.io/ |
| Prometheus C++ exporter | Github link |
| Setting up Prometheus | Prometheus codelab |
| Bazel build system | https://bazel.build/ |
