Metrics
- Requirements
- Installation
- Brief Overview
- Getting started
- Enable Metrics
- Enable Views
- Exporting stats
- End to end code
- Viewing your metrics
In this quickstart, we’ll glean insights from code segments and learn how to:
- Collect metrics using OpenCensus Metrics and Tags
- Register and enable an exporter for any backend of our choice
- View the metrics on the backend of our choice
Requirements
- Erlang 20.0 or above
- Rebar3
- Prometheus as our choice of metrics backend: we are picking it because it is free, open source and easy to setup
For assistance setting up Prometheus, Click here for a guided codelab.
You can swap out any other exporter from the list of Erlang exporters
Installation
For OpenCensus metrics functionality and Prometheus exporting just add the opencensus and opencensus_erlang_prometheus hex dependencies to your project’s rebar.config:
{deps, [opencensus, opencensus_erlang_prometheus]}.Brief Overview
By the end of this tutorial, we will do these four things to obtain metrics using OpenCensus:
- Create quantifiable metrics (numerical) that we will record
- Create tags that we will associate with our metrics
- Organize our metrics, similar to writing a report, in to a
View - Export our views to a backend (Prometheus in this case)
Getting Started
Unsure how to write and execute Erlang code? Click here.
We will be a simple “read-evaluate-print-loop” (REPL) app. In there we’ll collect some metrics to observe the work that is going on within this code, such as:
- Latency per processing loop
- Number of lines read
- Number of errors
- Line lengths
First, create a project named repl.
rebar3 new lib replNext, put the following code inside of src/repl.erl:
-module(repl).

-export([run/0]).

run() ->
    read_eval_process().

read_eval_process() ->
    Line = io:get_line("> "),
    Out = process_line(Line),
    io:format("< ~s~n~n", [Out]),
    read_eval_process().

process_line(Line) ->
    string:uppercase(Line).
You can run the code via rebar3 shell followed by repl:run()..
Enable Metrics
Include OpenCensus Application
To enable metrics, we’ll include opencensus application in our project’s .app.src file so it is started as a dependency of our application. Your src/repl.app.src will looks like:
{application, repl,
 [{description, "OpenCensus REPL example"},
  {vsn, "0.1.0"},
  {registered, []},
  {applications,
   [kernel,
    stdlib,
    opencensus,
    opencensus_erlang_prometheus
   ]},
  {env,[]},
  {modules, []},
]}.
To start the applications when running the rebar3 shell for development you’ll add the following to rebar.config:
{shell, [{apps, [repl]},
         {config, "config/sys.config"}]}.
Create Metrics
First, we will create the measures needed to later record our metrics.
measures() ->
    oc_stat_measure:new('repl/latency', "The latency in milliseconds per REPL loop", millisecond),
    oc_stat_measure:new('repl/errors', "The number of errors encountered", none),
oc_stat_measure:new('repl/line_lengths', "The distribution of line lengths", bytes).-module(repl).
-export([run/0]).
run() ->
measures(),
read_eval_process().
read_eval_process() ->
Line = read_line(),
Out = process_line(Line),
io:format("< ~s~n~n", [Out]),
read_eval_process().
read_line() ->
io:get_line("> ").
process_line(Line) ->
string:uppercase(Line).
measures() ->
oc_stat_measure:new('repl/latency', "The latency in milliseconds per REPL loop", millisecond),
oc_stat_measure:new('repl/errors', "The number of errors encountered", none),
oc_stat_measure:new('repl/line_lengths', "The distribution of line lengths", bytes).Inserting Tags
Now we will insert a specific tag called “repl” into the process dictionary.
ocp:with_tags(#{method => "repl"})-module(repl).
-export([run/0]).
run() ->
measures(),
read_eval_process().
read_eval_process() ->
ocp:with_tags(#{method => "repl"}),
Line = read_line(),
Out = process_line(Line),
io:format("< ~s~n~n", [Out]),
read_eval_process().
read_line() ->
io:get_line("> ").
process_line(Line) ->
string:uppercase(Line).
measures() ->
oc_stat_measure:new('repl/latency', "The latency in milliseconds per REPL loop", millisecond),
oc_stat_measure:new('repl/errors', "The number of errors encountered", none),
oc_stat_measure:new('repl/line_lengths', "The distribution of line lengths", bytes).Recording Metrics
Now we will record the desired metrics tagged with the tags we set above. To do so, we will use ocp:record/2.
process_line(Line) ->
    Start = erlang:monotonic_time(),
    Upper = string:uppercase(Line),
    ocp:record('repl/latency', erlang:convert_time_unit(erlang:monotonic_time() - Start,
                                                        native, millisecond)),
    ocp:record('repl/line_length', erlang:iolist_size(Line)),
Upper.-module(repl).
-export([run/0]).
run() ->
measures(),
read_eval_process().
read_eval_process() ->
ocp:with_tags(#{method => "repl"}),
Line = read_line(),
Out = process_line(Line),
io:format("< ~s~n~n", [Out]),
read_eval_process().
read_line() ->
io:get_line("> ").
process_line(Line) ->
Start = erlang:monotonic_time(),
Upper = string:uppercase(Line),
ocp:record('repl/latency', erlang:convert_time_unit(erlang:monotonic_time() - Start,
native, millisecond)),
ocp:record('repl/line_length', erlang:iolist_size(Line)),
Upper.
measures() ->
oc_stat_measure:new('repl/latency', "The latency in milliseconds per REPL loop", milliseconds),
oc_stat_measure:new('repl/errors', "The number of errors encountered", none),
oc_stat_measure:new('repl/line_lengths', "The distribution of line lengths", bytes).Enable Views
Create and Register Views
We now determine how our metrics will be organized by creating Views.
views() ->
    Views = [#{name => "demo/latency",
               description => "The distribution of the latencies",
               tags => [method],
               measure => 'repl/latency',
               aggregation => latency_distribution()},
             #{name => "demo/lines_in",
               description => "The number of lines from standard input",
               tags => [method],
               measure => 'repl/line_length',
               aggregation => oc_stat_aggregation_count},
             #{name => "demo/errors",
               description => "The number of errors encountered",
               tags => [],
               measure => 'repl/errors',
               aggregation => oc_stat_aggregation_count},
             #{name => "demo/line_length",
               description => "Groups the lengths of keys in buckets",
               tags => [method],
               measure => 'repl/line_length',
               aggregation => size_distribution()}],

[oc_stat_view:subscribe(V) || V <- Views].-module(repl).
-export([run/0]).
run() ->
measures(),
views(),
read_eval_process().
read_eval_process() ->
ocp:with_tags(#{method => "repl"}),
Line = read_line(),
Out = process_line(Line),
io:format("< ~s~n~n", [Out]),
read_eval_process().
read_line() ->
io:get_line("> ").
process_line(Line) ->
Start = erlang:monotonic_time(),
Upper = string:uppercase(Line),
ocp:record('repl/latency', erlang:convert_time_unit(erlang:monotonic_time() - Start,
native, millisecond)),
ocp:record('repl/line_length', erlang:iolist_size(Line)),
Upper.
measures() ->
oc_stat_measure:new('repl/latency', "The latency in milliseconds per REPL loop", milliseconds),
oc_stat_measure:new('repl/errors', "The number of errors encountered", none),
oc_stat_measure:new('repl/line_lengths', "The distribution of line lengths", bytes).
views() ->
Views = [#{name => "demo/latency",
description => "The distribution of the latencies",
tags => [method],
measure => 'repl/latency',
aggregation => latency_distribution()},
#{name => "demo/lines_in",
description => "The number of lines from standard input",
tags => [method],
measure => 'repl/line_length',
aggregation => oc_stat_aggregation_count},
#{name => "demo/errors",
description => "The number of errors encountered",
tags => [],
measure => 'repl/errors',
aggregation => oc_stat_aggregation_count},
#{name => "demo/line_length",
description => "Groups the lengths of keys in buckets",
tags => [method],
measure => 'repl/line_length',
aggregation => size_distribution()}],
[oc_stat_view:subscribe(V) || V <- Views].
latency_distribution() ->
{oc_stat_aggregation_distribution, [{buckets, [0, 25, 50, 75, 100, 200, 400,
600, 800, 1000, 2000, 4000, 6000]}]}.
size_distribution() ->
{oc_stat_aggregation_distribution, [{buckets, [0, 5, 10, 15, 20, 40, 60, 80,
100, 200, 400, 600, 800, 1000]}]}.Exporting stats
Include Exporting Application
We will be adding the Prometheus Erlang exporter hex package to rebar.config and application to repl.app.src:
{erl_opts, [debug_info]}.
{deps, [opencensus, opencensus_erlang_prometheus]}.

{shell, [{apps, [repl]},
{config, "config/sys.config"}]}.{application, repl,
[{description, "OpenCensus REPL example"},
{vsn, "0.1.0"},
{registered, []},
{applications,
[kernel,
stdlib,
opencensus,
opencensus_erlang_prometheus
]},
{env,[]},
{modules, []}]}.Create the exporter
In order for our metrics to be exported to Prometheus, our application needs to be exposed as a scrape endpoint. The simplest method to achieve this is to use Erlang’s included HTTP server through prometheus_httpd. Add the hex package to rebar.config and the applications to repl.app.src:
{erl_opts, [debug_info]}.
{deps, [opencensus, opencensus_erlang_prometheus, prometheus, prometheus_httpd]}.

{shell, [{apps, [repl]},
{config, "config/sys.config"}]}.{application, repl,
[{description, "OpenCensus REPL example"},
{vsn, "0.1.0"},
{registered, []},
{applications,
[kernel,
stdlib,
opencensus,
opencensus_erlang_prometheus,
prometheus_httpd,
inets
]},
{env,[]},
{modules, []}]}.Then in run/0 start the server:
run() ->
    prometheus_httpd:start(),
    measures(),
    views(),
    read_eval_process().
For production you might want to instead use Elli which can easily be setup to export Prometheus metrics and has an existing middleware for OpenCensus tracing and metrics.
Register the exporter
prometheus_registry:register_collector(oc_stat_exporter_prometheus)End to end code
Collectively the code will be
-module(repl).

-export([run/0]).

run() ->
    prometheus_registry:register_collector(oc_stat_exporter_prometheus),
    prometheus_httpd:start(),
    measures(),
    views(),
    read_eval_process().

read_eval_process() ->
    ocp:with_tags(#{method => "repl"}),

    Line = read_line(),
    Out = process_line(Line),
    io:format("< ~s~n~n", [Out]),
    read_eval_process().

read_line() ->
    io:get_line("> ").

process_line(Line) ->
    Start = erlang:monotonic_time(),
    Upper = string:uppercase(Line),
    ocp:record('repl/latency', erlang:convert_time_unit(erlang:monotonic_time() - Start,
                                                        native, millisecond)),
    ocp:record('repl/line_length', erlang:iolist_size(Line)),
    Upper.

measures() ->
    oc_stat_measure:new('repl/latency', "The latency in milliseconds per REPL loop", milliseconds),
    oc_stat_measure:new('repl/errors', "The number of errors encountered", none),
    oc_stat_measure:new('repl/line_length', "The distribution of line lengths", bytes).

views() ->
    Views = [#{name => "demo/latency",
               description => "The distribution of the latencies",
               tags => [method],
               measure => 'repl/latency',
               aggregation => latency_distribution()},
             #{name => "demo/lines_in",
               description => "The number of lines from standard input",
               tags => [method],
               measure => 'repl/line_length',
               aggregation => oc_stat_aggregation_count},
             #{name => "demo/errors",
               description => "The number of errors encountered",
               tags => [],
               measure => 'repl/errors',
               aggregation => oc_stat_aggregation_count},
             #{name => "demo/line_lengths",
               description => "Groups the lengths of keys in buckets",
               tags => [method],
               measure => 'repl/line_length',
               aggregation => size_distribution()}],

    [oc_stat_view:subscribe(V) || V <- Views].


latency_distribution() ->
    {oc_stat_aggregation_distribution, [{buckets, [0, 25, 50, 75, 100, 200, 400,
                                                   600, 800, 1000, 2000, 4000, 6000]}]}.

size_distribution() ->
    {oc_stat_aggregation_distribution, [{buckets, [0, 5, 10, 15, 20, 40, 60, 80,
                                                   100, 200, 400, 600, 800, 1000]}]}.
Running the tutorial
This step involves running the tutorial application in one terminal and then Prometheus itself in another terminal.
rebar3 shell --sname repl@localhost

(repl@localhost)1> repl:run().
Prometheus configuration file
To enable Prometheus to scrape from your application, we have to point it towards the tutorial application whose server is running on “localhost:8081”.
To do this, we firstly need to create a YAML file with the configuration e.g. promconfig.yaml
whose contents are:
scrape_configs:
  - job_name: 'ocmetricstutorial'

    scrape_interval: 10s

    static_configs:
      - targets: ['localhost:8081']
Running Prometheus
With that file saved as promconfig.yaml we should now be able to run Prometheus like this
prometheus --config.file=promconfig.yamland then return to the terminal that’s running the Erlang metrics tutorial and generate some work by typing inside it.
Viewing your metrics
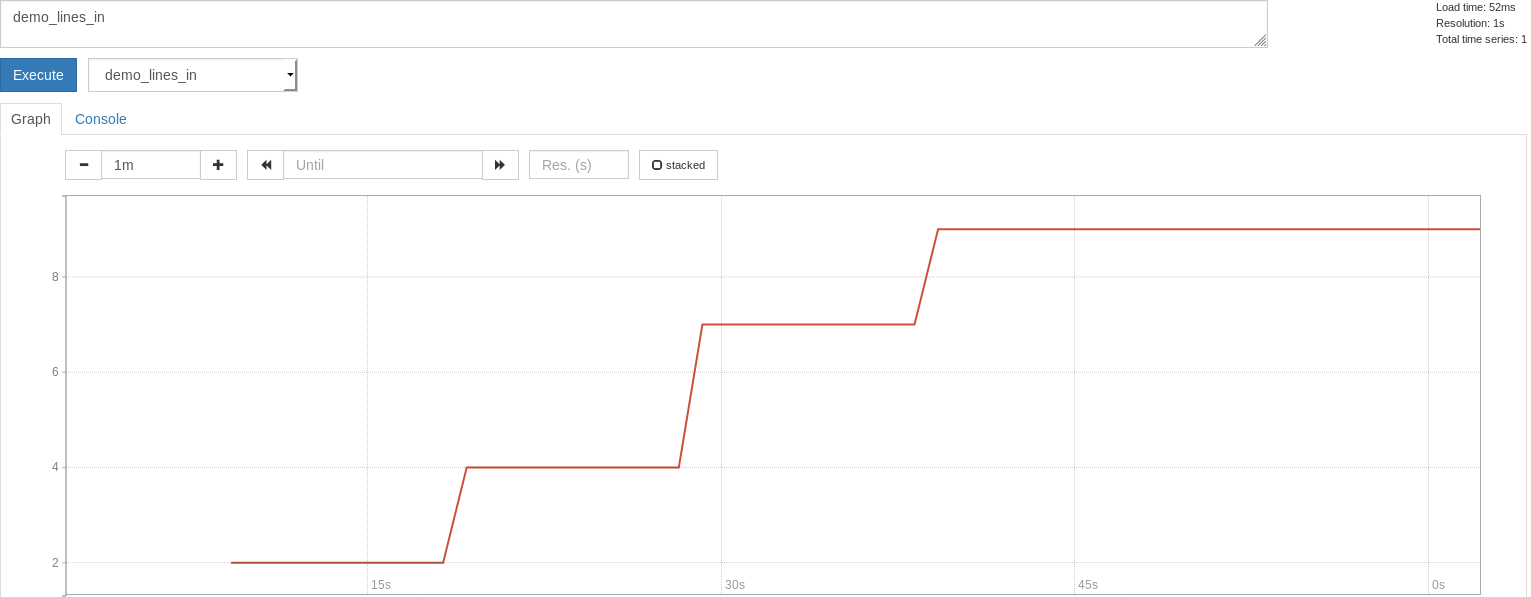
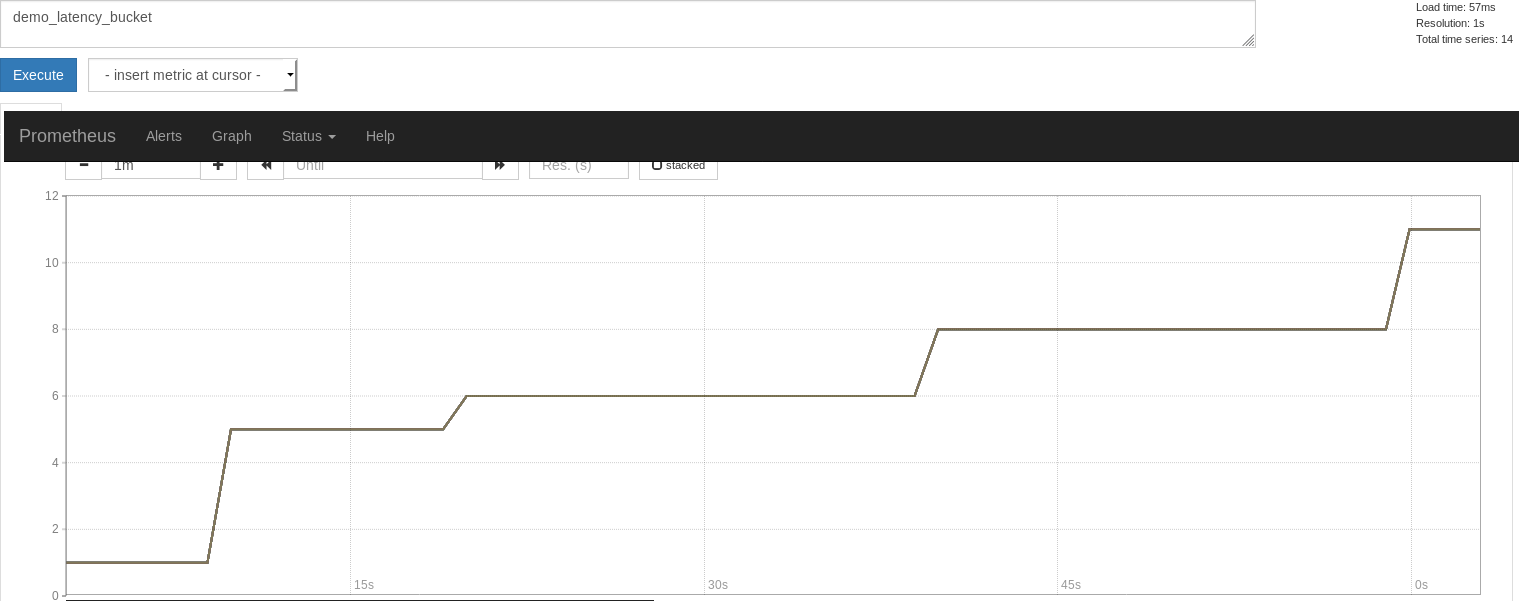
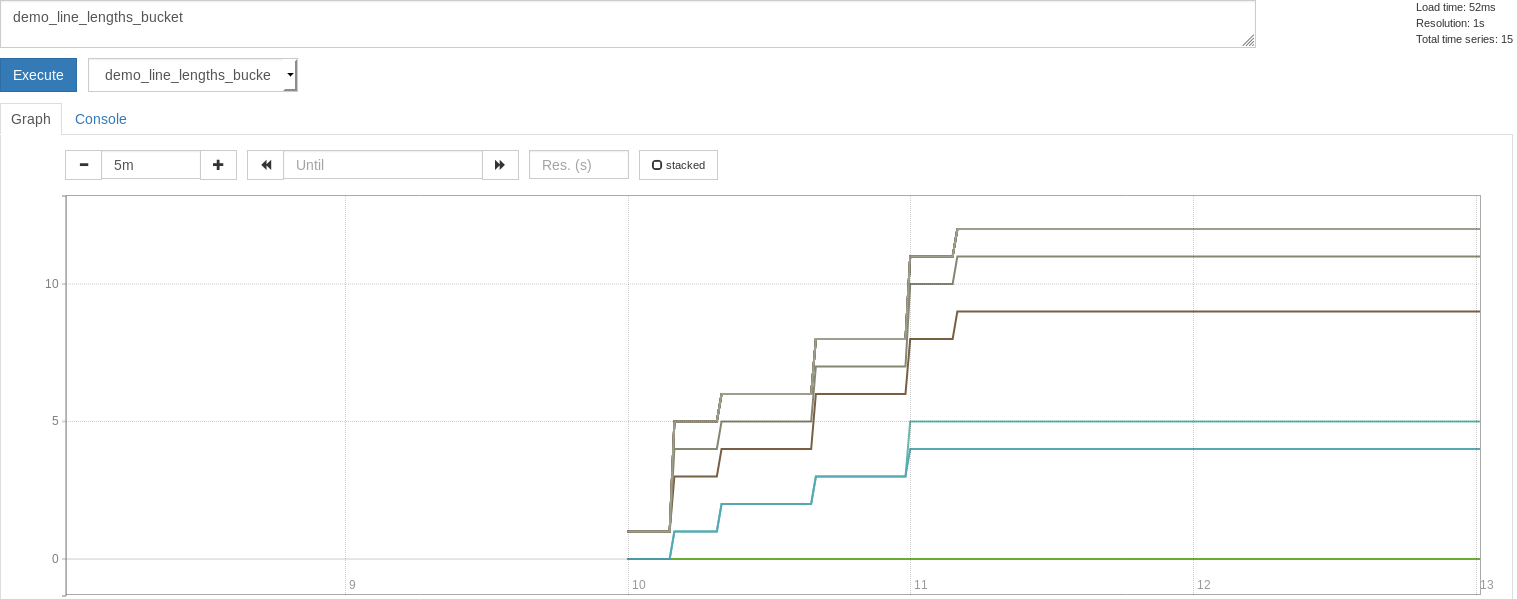
With the above you should now be able to navigate to the Prometheus UI at http://localhost:9090
which should show:
Lines-in counts

Latency distributions

Line lengths distributions

| Resource | URL |
|---|---|
| Prometheus project | https://prometheus.io/ |
| Prometheus Erlang exporter | https://github.com/opencensus-beam/prometheus |
| OpenCensus Erlang package | https://github.com/census-instrumentation/opencensus-erlang |
